

![Increase of Web Attacks 2010-2012 | mLearning - BYOD [Infographic] | WEBOLUTION! | Scoop.it](https://www.symantec.com/content/en/us/enterprise/images/security_response/SYMC-ISTR-webattack-page12.jpg)
Research and publish the best content.
Get Started for FREE
Sign up with Facebook Sign up with X
I don't have a Facebook or a X account
Already have an account: Login

WEBOLUTION!
5.8K views |
+0 today

 Your new post is loading...
 Your new post is loading...
Your new post is loading...
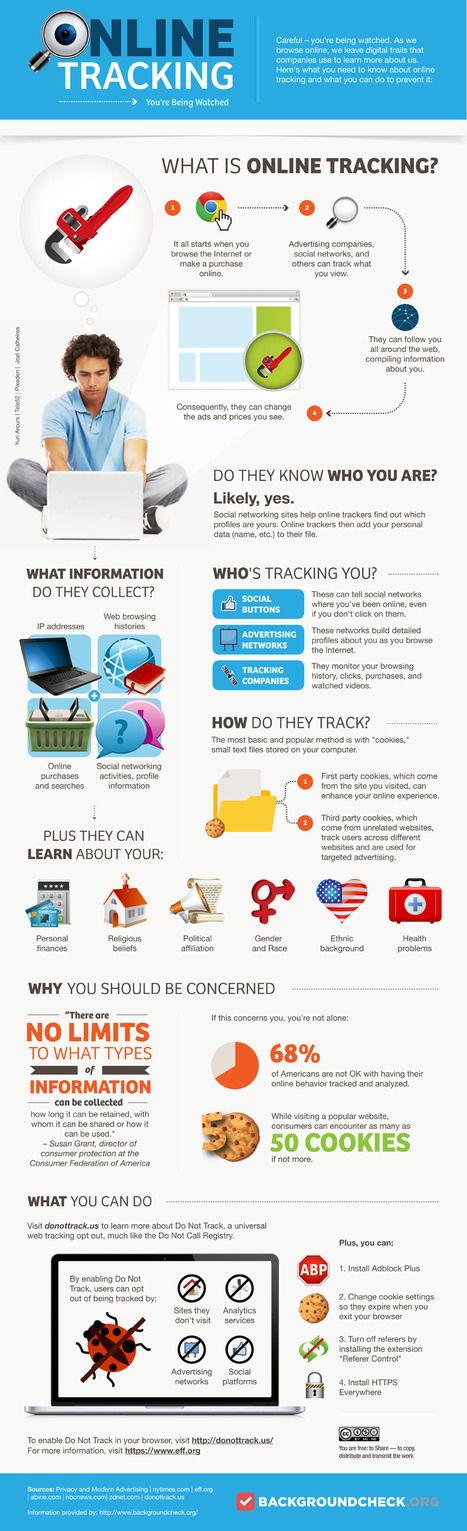
With social buttons, cookies, and watching our online purchases, advertisers are compiling a lot more information about you than you think. Via Gust MEES 

Gust MEES's curator insight,
March 5, 2013 6:25 AM
Privacy at danger!!! Check also:
- http://www.scoop.it/t/21st-century-learning-and-teaching?tag=Privacy
- http://www.scoop.it/t/securite-pc-et-internet?tag=Privacy
Gust MEES's curator insight,
March 5, 2013 6:28 AM
Privacy at danger!!! Check also:
- http://www.scoop.it/t/21st-century-learning-and-teaching?tag=Privacy
- http://www.scoop.it/t/securite-pc-et-internet?tag=Privacy

I must admit that I find the field of infographics fascinating. In my Zite reader, I'm excited when one of them makes any of the categories that I follow and, to be sure that I get a daily fix, I ...
Here’s one of the infographics that I spent time looking at this morning. It’s titled “The pros and cons of social media in education” and was blogged by the Edtech Times who credit the authorship to OnlineUniversities.com.
Via Gust MEES, juandoming
Gust MEES's curator insight,
February 24, 2013 9:03 AM
Check for more infographics here:
- http://www.scoop.it/t/21st-century-learning-and-teaching?tag=Infographic
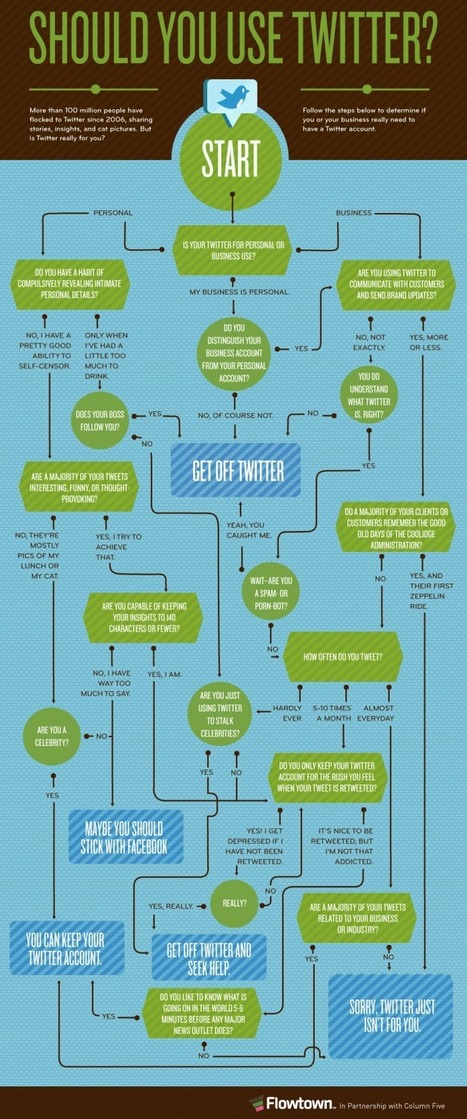
We're all already using Twitter it seems. But should we? This flowchart answers the big question: should you use Twitter? Via Gust MEES

Ed Bonhaus's curator insight,
January 14, 2013 1:43 PM
After following this flow chart, I've discovered that I should continue using Twitter.
![10 Spooky Cyberattacks in 2012 [INFOGRAPHIC] | WEBOLUTION! | Scoop.it](https://img.scoop.it/ERkO2HylZtUYHsbOLAIDyDl72eJkfbmt4t8yenImKBVvK0kTmF0xjctABnaLJIm9)
With big names such as Zappos, Amazon, LinkedIn and Android gracing the list, there's a good chance you have fallen victim to a security breach this year.
It’s been a chilling year so far for web and mobile security. Cybercriminals continue to think of clever and sneaky ways to strip millions of consumers of credit card information and personal data, thanks largely in part to malicious links, phishing scams and password hacks.
The team at cybercrime prevention company ThreatMetrix has put together an infographic detailing the top 10 spookiest cyberattacks of the year so far. And with big names such as Zappos, Amazon, LinkedIn and Android gracing the list, there’s a good chance you or someone you know has fallen victim to a security breach.
Read more, a MUST: http://mashable.com/2012/10/18/cyber-attacks-201/
Via Gust MEES
|
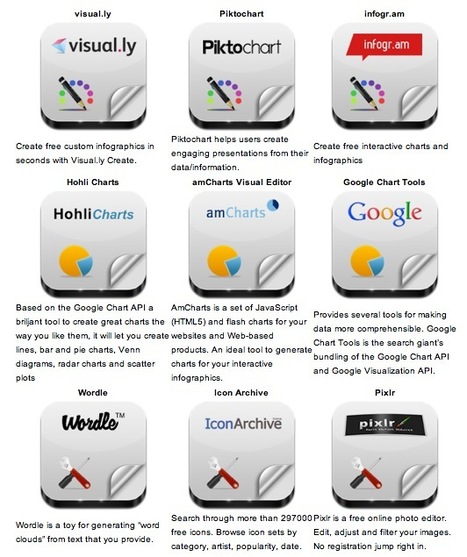
Robin Good: Here is a handy short guide to nine free infographic creation tools that can be utilized to create enticing visuals, word charts and data-based infographics without having special technical skills.
Useful. 8/10
Check them all out: http://www.infographicsarchive.com/create-infographics-and-data-visualization/ ;
(Unearted by Andres Taborga) Via Robin Good, Jim Lerman, Gust MEES

Sahana Chattopadhyay's curator insight,
May 4, 2015 11:59 PM
Infographics are great tools to present curated and focused content from a specific perspective.

AlGonzalezinfo's curator insight,
March 10, 2013 9:05 AM
G+ is catching up big time for many reasons. Among these reasons is the Hangout integration.
We just facilitated a remote 1.5 day leadership development session with Hangouts and it was fantastic.
Google is sticking to their strategy and their value is starting to win people over. I was never a fan and, through valuable features, I am changing my perspective on the suite of offerings.
This is a relevant infographic.

Pinterest is a promising visual bookmarking platform. It is gaining in popularity more and more and of course teachers and educators are part of this success for there are now a burgeoning number of educational boards on Pinterest where you can get free access to tons of web tools and teaching tips.There are also some great educational Pinners that are committed to sharing useful resources with their fellow teachers. In this regard, Educational Technology and Mobile Learning has its own Pinterest Board where we have been pinning everything we publish here or we find in other blogs and websites, make sure to follow us to stay updated about our future pinnings. Via Andrea Zeitz, Les Howard, Lynnette Van Dyke, Gust MEES
![How Technology Has Impacted Education [Infographic] | WEBOLUTION! | Scoop.it](https://img.scoop.it/kYwOGrZVybpujL_NiyxD1Dl72eJkfbmt4t8yenImKBVvK0kTmF0xjctABnaLJIm9)
Technology has made tremendous inroads into education over the past couple of years. It's been ramping up to a fever pitch and you can't swing a mouse without hitting a classroom.
Read more, a MUST: http://edudemic.com/2012/11/how-technology-has-impacted-education/
Via Gust MEES
|


![20 Reasons Why you Should Use Google Plus [Infographic] | WEBOLUTION! | Scoop.it](https://img.scoop.it/j1fJ08aqSCOFcw0g2J6fxjl72eJkfbmt4t8yenImKBVvK0kTmF0xjctABnaLJIm9)


Check also:
- https://gustmees.wordpress.com/2012/11/29/cyber-hygiene-ict-hygiene-for-population-education-and-business/
- https://gustmees.wordpress.com/2012/07/11/cyberhygiene-hygiene-for-ict-in-education-and-business/
Check also other infographics here:
- http://www.scoop.it/t/securite-pc-et-internet?tag=Infographic
- http://www.scoop.it/t/21st-century-learning-and-teaching?tag=Infographic