Into the Driver's Seat
454.0K views | +2 today
Follow
Into the Driver's Seat
Building learners' independence through thoughtful technology use
Curated by Jim Lerman
Your new post is loading...
Rescooped by Jim Lerman from visual data
Scoop.it!

Dazzling Infographics Design Elements: Vector Resources

Dazzling Infographics Design Elements: Vector Resources | Into the Driver's Seat | Scoop.it

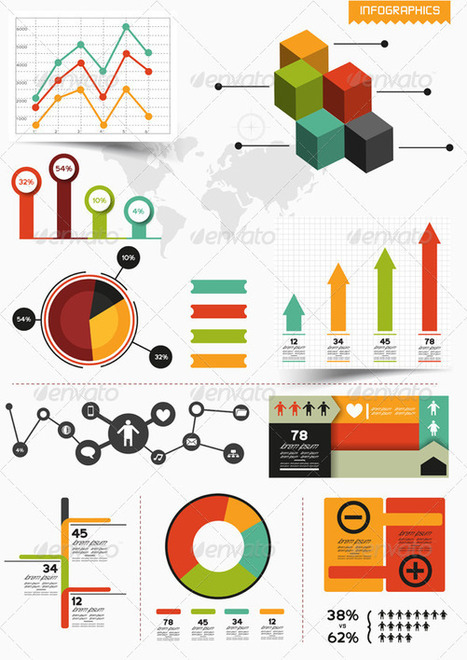
Information graphics or infographics are graphic visual representations of information, data or knowledge intended to present complex information quickly and clearly.

The process of creating infographics can be referred to as data visualization, information design, or information architecture. In newspapers, infographics are commonly used to show the weather, maps, site plans, charts and graphs for statistical data.


These infographic element kits are all editable vector shapes in organized file formats, for use in presentation, print files or web site graphics.


Via Lauren Moss
No comment yet.
Rescooped by Jim Lerman from Presentation Tools
Scoop.it!

The Best App To Create Professionally Looking Charts and Graphs: Infogr.am

The Best App To Create Professionally Looking Charts and Graphs: Infogr.am | Into the Driver's Seat | Scoop.it

Registration required, free to use. -JL


Robin Good: This has got to be a dream come true.


Create professionally-looking interactive graph charts (and soon also full infographics) with the best tool and easiest interface available out there.


Infogr.am makes it as easy as it can possibly be the creation of charts that will always look great and effective no matter what your design skill level is.


You simply choose the type of graph you want (bar, line, pie, matrix) to create, edit the existing data with your own, and you are ready to go.


Each chart is designed following some basic information design principles, allowing data to be easily read and for the chart to look very credible and "professional".


Also: each chart created with Infogram can be easily embedded on any web site, and customized in size and colors used.


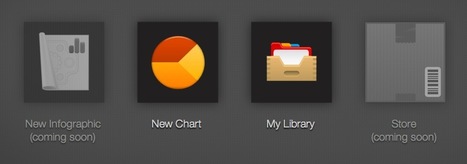
Infogram integrates an online library where to save your completed work, and an upcoming online store.

Try it out now: http://infogr.am/app/  


Awesome. 10/10 


Via Robin Good
No comment yet.
Rescooped by Jim Lerman from visual data
Scoop.it!

Dazzling Infographics Design Elements: Vector Resources

Dazzling Infographics Design Elements: Vector Resources | Into the Driver's Seat | Scoop.it

Information graphics or infographics are graphic visual representations of information, data or knowledge intended to present complex information quickly and clearly.

The process of creating infographics can be referred to as data visualization, information design, or information architecture. In newspapers, infographics are commonly used to show the weather, maps, site plans, charts and graphs for statistical data.


These infographic element kits are all editable vector shapes in organized file formats, for use in presentation, print files or web site graphics.


Via Lauren Moss
No comment yet.