

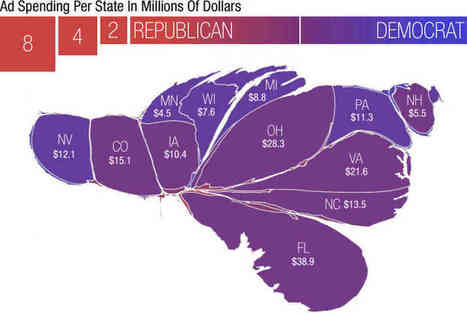
We've reshaped the United States based on where superPACs and other outside groups spent their money to air political ads aimed at influencing the presidential election. The result? One weirdly telling map.
Via Jack Loring
Get Started for FREE
Sign up with Facebook Sign up with X
I don't have a Facebook or a X account


 Your new post is loading...
 Your new post is loading...
Your new post is loading...
We've reshaped the United States based on where superPACs and other outside groups spent their money to air political ads aimed at influencing the presidential election. The result? One weirdly telling map. Via Jack Loring 
No comment yet.
Sign up to comment
|

From
maplight

MapLight has conducted an analysis of campaign contributions from companies and organizations to the sitting members of Congress from each state. In collaboration with Tableau Public, MapLight has presented this research data in a visualization, displaying logos of each state’s “owner,” making it possible to see which groups are seeking to influence members of Congress across the country. Clicking the logo on a state will show the top five contributors. Via Jack Loring
|


