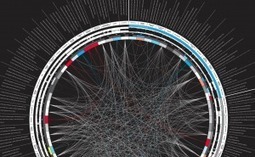
I love a good infographic! After all, knowledge is power and the visualization of data makes absorbing information all the easier. Well-designed infographics have a way of pulling me into a subject I'd normally never care to know about.
As a designer I can attest to the crazy amount of time it takes to make a compelling, useful infographic. I have to say I knew about many of the great links, resources and tools I’ve linked to here on this post before but I dug deep and found some new and exciting infographic tools that I’m willing to bet you haven’t seen before. Items 1-5 under the Data Visualization Tools and Software category are sufficiently capable of arming even a novice designer with the ability to produce a powerful infographic (though I’m sure experts will find them handy as well). In short, if you love infographics, data visualization and information design as much as I do, you’re going to love this post...
Via Lauren Moss


 Your new post is loading...


