Journalisme graphique
142.0K views | +0 today
Follow
Journalisme graphique
La veille de Wedodata, studio de datavisualisations : wedodata.fr
Curated by Karen Bastien
Your new post is loading...
Rescooped by Karen Bastien from visual data
Scoop.it!

Top 10 Video Infographics of 2012

Top 10 Video Infographics of 2012 | Journalisme graphique | Scoop.it

In the great tradition of end of year blog posts, here's a feature on the top 10 video infographics of 2012.


Over the year, I’ve curated 222 videos on this site [videoinfographics.net], and reviewed hundreds more. As part of my process of watching and curating so many infographic videos, I started to keep my own 3-star ranking system of these videos in a spreadsheet to help me keep track of those that I think are the most outstanding. The result was about 60 3-star videos in 2012. That’s too many to feature in a top X list so I turned to the Likes and Comments of my top ranked videos (and in doing so eliminated videos only featured on YouTube since YouTube comments are pretty much trash). This resulted in a list of 10 videos that had triple digit Likes on their Vimeo pages.

Voila! A top 10 list. So, in a ascending order, here are the top 10 most liked animated video infographics featured here in 2012, including number of Likes and Comments for each (as of December 30, 2012).


Via Lauren Moss
No comment yet.
Rescooped by Karen Bastien from visual data
Scoop.it!

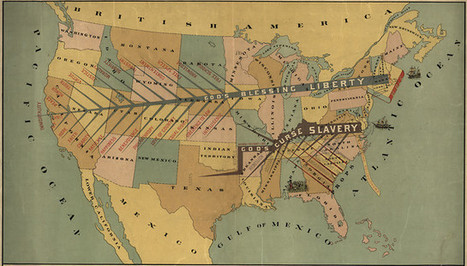
11 of the Most Influential Infographics of the 19th-Century...

11 of the Most Influential Infographics of the 19th-Century... | Journalisme graphique | Scoop.it
We live in a world steeped in graphic information. From Google Maps and GIS to the proliferation of infographics and animated maps, visual data surrounds us.

While we may think of infographics as a relatively recent development to make sense of the immense amount of data available on the Web, they actually are rooted in the 19th century.

Two major developments led to a breakthrough in infographics: advances in lithography and chromolithography, which made it possible to experiment with different types of visual representations, and the availability of vast amounts of data, including from the American Census as well as natural scientists, who faced heaps of information about the natural world, such as daily readings of wind, rainfall, and temperature spanning decades.

But such data was really only useful to the extent that it could be rendered in visual form. And this is why innovation in cartography and graphic visualization mattered so greatly...


Via Lauren Moss
No comment yet.