 Your new post is loading...
From simple charts to complex maps and infographics, Brian Suda's round-up of the best – and mostly free – tools has everything you need to bring your data to life... A common question is how to get started with data visualisations. Beyond following blogs, you need to practice – and to practice, you need to understand the tools available. In this article, get introduced to 20 different tools for creating visualisations: from simple charts to complex graphs, maps and infographics. Almost everything here is available for free, and \you may have installed already...
Via Lauren Moss
We just released an infographic about the rise of content curation as a content marketing tactic. The visual examines how curation can be used to increase visibility, boost SEO, and establish thought leadership – all in a cost-effective way and with limited resources. “There’s much more to content curation for marketers than simply aggregating and amassing content. Marketers can add value by analyzing and re-purposing each piece of information,” says Neil Bhapkar, Director of Marketing at Uberflip. 'Content curation can enable marketers to re-channel relevant content to spark engagement and awareness with customers and prospects.'"
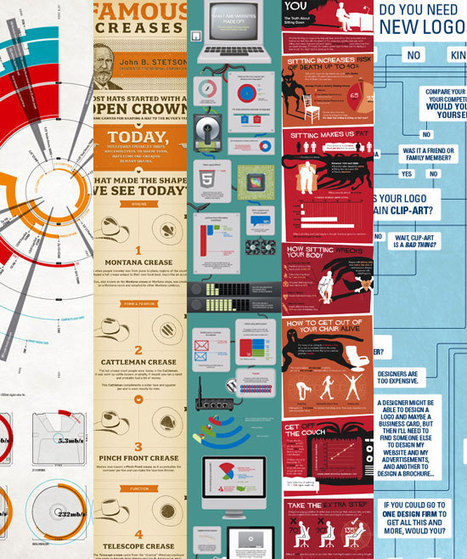
Infographics seem to be a real trend today, with new ones popping up daily on all sorts of subjects. Infographics seem to be a real trend today, with new ones popping up daily on all sorts of subjects. From mortgages to ice cream, estimating software to infographics about infographics, there is very little now that hasn't been 'visualised' in some form. Many people don't realise that the term information graphic, or 'infographic' was first coined over 100 years ago, with the Coxcomb chart by Florence Nightingale in 1857 being one of earliest recognised examples. They have existed in many forms since then, but only in the past few years have infographics developed into the art form we know today. Read more and find also the best tools to create Infographics: http://www.queness.com/post/9942/how-to-design-your-own-infographics
Via Ana Cristina Pratas, Gust MEES
Let's face it, the infographics industry is exploding and now we’re seeing some new tools to help us easily create or generate simple infographics. Creating and interpreting infographics can form a basis for a wide variety of lessons, in any subject at any grade level,
Via Donna Browne
"Using the wrong colors for your brand might turn customers away, according to this infographic. As such, picking the right color is of great importance not just to how people perceive your brand. It also impacts your bottom line. Another interesting tidbit: Red and blue are apparently the most popular colors among the world’s top 100 brands."
"I was recently travelling through Italy and having an iPhone allowed me to share what I was experiencing in real time to my Facebook timeline and to Twitter."
"The BBC has created a very, very large infographic titled “How Big Is Our Solar System?” Scroll down (which is a little odd) and it will take you from the surface of earth to the far reaches of space."
An infographic snapshot of the rapidly changing world of computing, communications and technology. A GLOBAL INTERNET In just four decades the Internet has spread to much of the world. Now, the shift to high-bandwidth connectivity and the global availability of supercomputing is accelerating. A MORE CONNECTED WORLD Cellphones are proliferating rapidly in much of the developing world. The use of smartphones and other Internet-connected devices is still low, but should rise quickly in countries like China, which will soon have the world’s largest domestic market for Internet commerce and computing. TOWARD AN INNOVATIVE CHINA China is the dominant maker of computers and consumer electronics, and is readily able to adapt and improve on technology innovations made elsewhere. But innovation within the country has been limited by government controls and the relative lack of intellectual property protection.
|
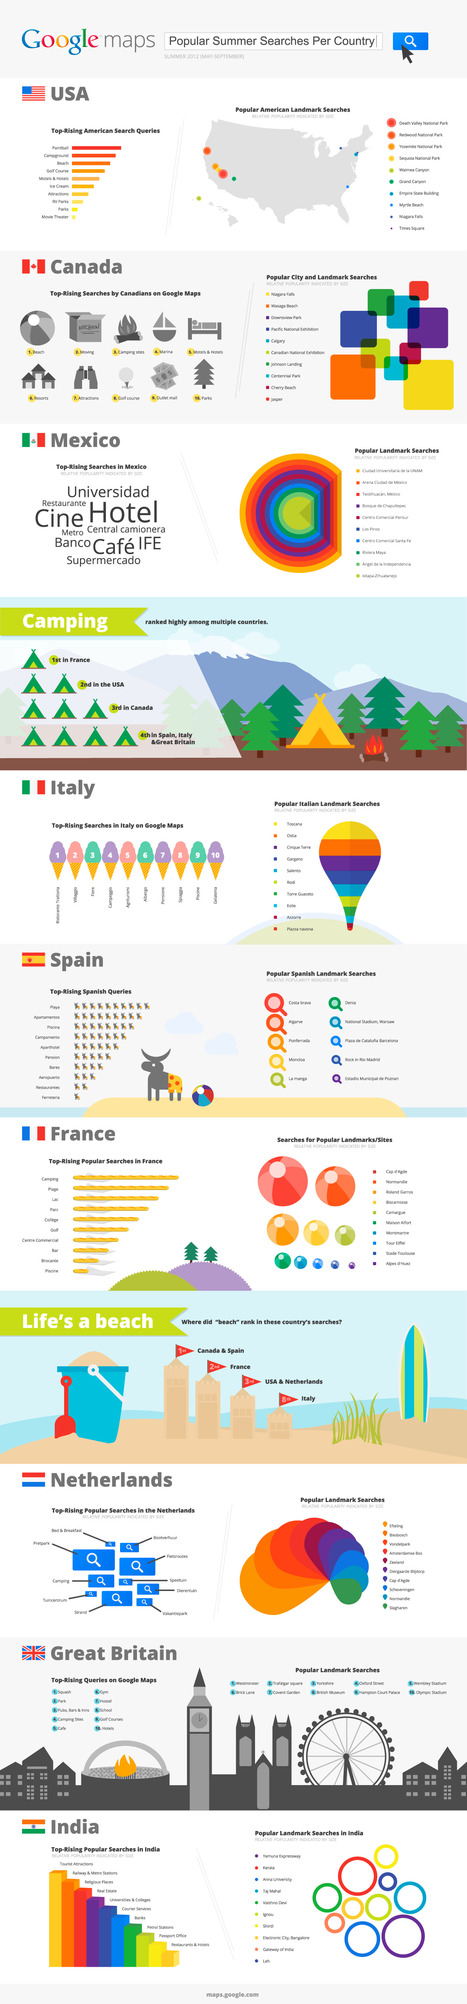
"In the blink of an eye, summer is coming to an end. It feels like it was just yesterday that I was planning out all my summer activities as I eagerly awaited the start of long, sunny days and warm nights. Before we approach the official end of summer on September 21, our Google Maps team thought it’d be fun to see how those of us in the Northern Hemisphere have spent the dog days. To do this, we reviewed the summer search activity on maps.google.com in several countries between the end of May and the beginning of September. Within each country, a look at some of the top-rising searches and the often-searched landmarks on Google Maps gives us a sense of how people around the world spent their summers."
People love to learn by examining visual representations of data. That’s been proven time and time again by the popularity of both infographics and Pinterest. So what if you could make your own infographics? What would you make it of? It’s actually easier than you think… even if you have zero design skills whatsoever.
Via Baiba Svenca
"This data comes courtesy of Ignite Social Media, who have compiled the infographic of infographics about the state of social media, worldwide, in 2012. Ignite’s research revealed that while social media as a whole continues to plateau – we haven’t seen any real growth, planet-wide, since 2009 – there are many success stories to be found. Pinterest has quickly established itself as the de facto social network for women, and Plaxo (who knew that was still going?) is incredibly popular with senior citizens."
Information can be useful--and even beautiful--but only when it’s presented well. In an age of information overload, any guidance through the clutter comes as a welcome relief. That’s one reason for the recent popularity of information graphics. This post includes 10 steps to help you create an infographic, beginning with gathering data and ending with releasing your infographic to the world.
Via Beth Dichter
Turnitin is the leading academic plagiarism detector, utilized by teachers and students to avoid plagiarism and ensure academic integrity.
"hanks to Nik Peachey, today I learned about Easel.ly today, which is hands-down the easiest tool I’ve seen on the Web to create infographics. You just “drag-and-drop” a variety of themes, type in your data, and you’ve got a great infographic."
"Infographics are viral. In my own PLN, one of us discovers an infographic relevant to learning or libraries or research and it’s all over the edtech/library world in a matter of minutes. The infographic, Wikipedia: Redefining Research appeared on Open-Site recently, documenting the end of Britannica’s long print-based history and Wikipedia’s growing prominence as a reference source. After 244 years, the Encyclopedia Britannica has decided to halt the presses and go out of print. Facing the realities and the stiff competition from Wikipedia, the Encyclopedia Britannica will now focus primarily on their online services. But even then, it might be too late. Wikipedia has grown to be the number one source for students. In fact, many students will stop research and change topics if it’s not on Wikipedia. As I looked more carefully at the infographic, as I really read it, I began to see some distorted truths and some opportunities for information literacy explorations. I saw many jumps in logic. But I will focus here on just a few that are closest to my heart."
This site will provide you with links, ideas, tips, and much more for supporting the use of infographics as an assessment option in the classroom. The site has three informational pages, linked on the right.
- The first page provides a list of links to support my infographics presentation.
- The second page includes a Google Form for you to add your own ideas, practices, or links to information you have found.
- The third page provides contact information for me, in case you have ideas, suggestions, criticisms, witticisms, or just want to chat!
via Susan Bainbridge http://tinyurl.com/cj44nvj
"If there's a prize for best infographic, ever, then Randall Munroe has won. Hands down. The winner? His Money infographic posted Monday. This monster infographic comes with full sources in CSV format and covers everything from Barenaked Ladies to 2012 presidential fundraising.
If you ever wanted to see money put into very detailed perspective, this will do it for you. Munroe starts with visualizations based on the dollar, like a Starbucks Coffee ($2.00) to a comparison of hourly worker and CEO pay between 1965 and 2007.
From there, Munroe goes on to compare box office revenue from Snow White to Avatar, and annual profits of AT&T, Verizon, and JP Morgan Chase. The U.S. Household Income visualization alone is worth the time downloading the 6.7MB image. See also the section on billionaires."
via @jennyluca
|


![Why Teachers Want Technology [Infographic] | Learning, Teaching & Leading Today | Scoop.it](https://img.scoop.it/wFv2rXBKadmkuqHZDf0jkzl72eJkfbmt4t8yenImKBVvK0kTmF0xjctABnaLJIm9)


![The Current State Of Social Networks 2012 [INFOGRAPHIC] | Learning, Teaching & Leading Today | Scoop.it](https://img.scoop.it/DyPpSY85_GynF6yfJub2jTl72eJkfbmt4t8yenImKBVvK0kTmF0xjctABnaLJIm9)

![Plagiarism Report [INFOGRAPHIC] - Turnitin Community | Learning, Teaching & Leading Today | Scoop.it](https://img.scoop.it/x4PNZVZbPGuWz2fGCJkMxjl72eJkfbmt4t8yenImKBVvK0kTmF0xjctABnaLJIm9)


This looks like it might be a good source for integrating infographics into the classroom.