


The map provides a level of detail previously unavailable. It is the first ever to collect data published by all of Europe’s municipalities.
Get Started for FREE
Sign up with Facebook Sign up with X
I don't have a Facebook or a X account


 Your new post is loading...
 Your new post is loading...
Your new post is loading...
The map provides a level of detail previously unavailable. It is the first ever to collect data published by all of Europe’s municipalities. 

Olivia Campanella's curator insight,
October 1, 2018 4:35 PM
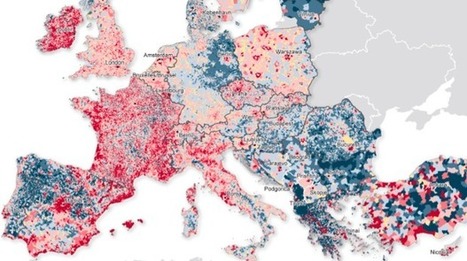
Europe has been undergoing intense demographic change and this map is the first ever collect data published by Europe. How this map works:
The Dark Blue color shows average annual population fall of 2% or more The Medium Blue shows the average annual population fall of between 1 and 2% and Light Blue shows a fall of 1%. The areas in tan experienced no change at all. Areas in Deep Red show a rise of 2% or more in population, while in areas of Medium Red (1-2%) and Pale Pink (1%). 
K Rome's curator insight,
October 6, 2018 7:31 PM
Europe has been undergoing intense demographic change and this map is the first ever collect data published by Europe. How this map works:
The Dark Blue color shows average annual population fall of 2% or more The Medium Blue shows the average annual population fall of between 1 and 2% and Light Blue shows a fall of 1%. The areas in tan experienced no change at all. Areas in Deep Red show a rise of 2% or more in population, while in areas of Medium Red (1-2%) and Pale Pink (1%). 
othni lindor's curator insight,
October 20, 2018 2:45 AM
This article shows the population patterns of Europe between 2001 and 2011. Many cities have had a high rise in average annual population of 2 percent or more. This map also shows that there has been more migration in northwest Europe. Citizens have left certain cities in search of better job opportunities. The population in Germany is sparse except in Berlin. Spain has had a big drop in population overall. Many people living in more rural regions have moved to cities and many others are moving to coasts for retiring or downsizing.
Sign up to comment
|


