What is a Graphiq Visualization?Pre-Designed: 10 billion visualizations at your fingertips
Authoritative: built upon the world's deepest knowledge graph
Live-updating: as the data changes, so will the visualization
Embeddable: simple integration with leading content management systems
Responsive: on any device and browser
There are more than 10 billion visualizations in our library, from President Obama's approval rating to Apple's stock performance over time, and thousands get added every day.
Graphiq Visualizations enrich editorial content, augment third-party applications, and power our own leading research sites.
To find the right visualization, enter a term on Graphiq Search to see all matching results. When you've found the right visualization, copy and paste the embed code onto the page where you'd like it to appear. It's that simple....


 Your new post is loading...


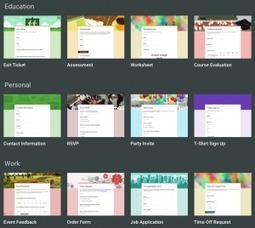


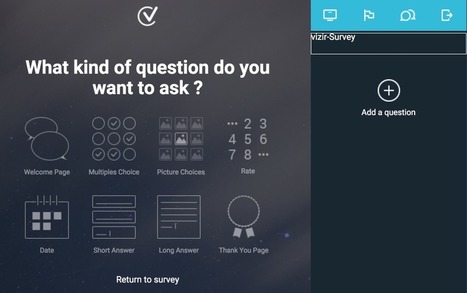


A collection of tools for creating different kinds of surveys.
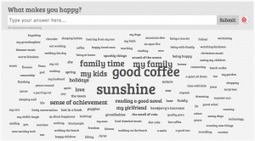
her er noen tips dersom du skal lage ordskyer eller enkle spørreundersøkelser for å fremme læringsutbytter i undervisningen