 Your new post is loading...
As Big Data matures beyond the hype, organizations are re-evaluating how they approach it. Jascha Kaykas-Wolff, CMO at Mozilla, describes an interesting strategic shift from “Big Data” to “Lean Data”: “For growth-minded companies, collecting customer data for the sake of collecting data is more risk than the rewards can usually justify. Instead, we should be looking for ways to collect less data and go lean. Why? Because our collection tools create expensive overhead and risks that are impacting the trust of our customers in a negative way… “For the most part, compiling bigger and more complex sets of customer data will not lead to the big profit and marketshare breakthroughs that Big Data promises. Instead, we marketers must learn to live and think lean. The twin false gods of Big Data and MarTech will continue to encourage thousands of marketers to gather all the data they can wielding an ever-expanding arsenal of tools to sift through it all, with little discussion about whether the mad scramble to vacuum up customer info is worth the trouble, expense, and risk…...
April 18, 1521, Martin Luther faces Emperor Charles the V in the Heylshof Garden to defend the infamous 95 Theses. Few people noticed the quiet banker in the room, simply known as “Jakob the Rich.” Jakob is a common merchant who will become the richest person who’s ever lived. Jakob will go on to accumulate a personal net worth equivalent to 2% of Europe’s GDP at the time. Jakob’s net worth is basically Bill Gates + Warren Buffet + Jeff Bezos combined — then doubled. Who the was Jakob the Rich? Why was he at Martin Luther’s trial? How did he get so damn rich? Well, he was a data-hungry banker looking after his investment. Over the previous 16 years, Jakob had been lending the Catholic Church money — and the Pope had racked up an enormous debt. In order to pay off those debts, the Church launched a campaign for people to pay to have themselves and their deceased family members absolved of all sins....
Thanks to my friends at Dell, I received access to the latest EMA/9sight Big Data research. The report, a survey of 351 business and technology stakeholders around the world, illuminates key trends surrounding the adoption, expectations, and challenges associated with Big Data initiatives.
I found this interesting and you will too. Here are some highlights
If you’ve noticed fewer window shoppers on the streets lately, it may be because they’re at home window shopping from their couches; that is, they’re discovering and exploring products without necessarily intending to purchase.
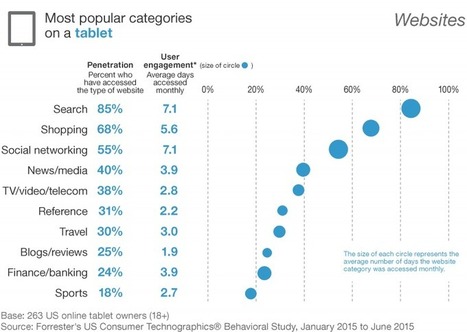
For our 2015 US Mobile Landscape report*, Forrester analyzed mobile audience data from our behavioral tracking panel to understand how consumers use smartphones and tablets in 2015. We found that although professionals often group both devices under the “mobile” umbrella, consumers use smartphones and tablets in very different ways.
One notable difference centers on mobile commerce: While smartphone commerce is still struggling to get traction, for tablets it’s already one of the most common activities. In fact, Forrester’s US Mobile Phone And Tablet Commerce Forecast, 2015 To 2020 shows that total tablet retail purchases more than double those made on a smartphone.
Our behavioral data shows that in the first half of 2015, 68% of tablet owners visited a shopping site at least once in a given month — that’s more than the number who visited news/media, TV/video, or even social networking sites! And these tablet shoppers aren’t just visiting Amazon.com. Only about half took to Amazon —the other half visited other online shopping websites that fit their interests, brand preferences, and lifestyle....
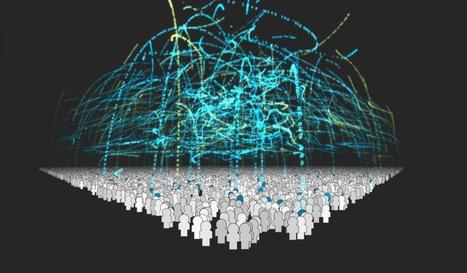
Big Data is that buzzword that describes the increasing volume of data surrounding every aspect of human life. It refers to the idea that nearly every human action can be quantified and logged in a bank of data that is growing at an unprecedented rate. In fact, there are nearly as many pieces of digital information as there are stars in the universe.
Marketers look into this vat of data bug-eyed and frothing at the mouth.
Why? Because Big Data holds the potentially to describe target customers with an accuracy and level of detail unfathomable only a decade ago. While old-school marketing efforts were limited to things like tracking returns on direct mail campaigns, or number of subscribers to newsletters, modern marketers can have data on people’s exercise habits, digital clicking behavior, time spent on various sites, purchasing history, personal preferences based on social media postings, time awake, time spent in the car, caloric intake, and almost anything else you can imagine....
So how can an analyst get into a consumer’s mind by analyzing Tweets and how would this information be useful?
To find some answers I teamed up with Marketing Strategist Dr Nikos Dimitriadis to assist me in the actionability and interestingness of each extracted insight.
Note that we capture thoughts from a biased sample which means that we cannot make inferences about the general population. However this work can be a great additional tool for finding new ideas and insights for Marketing initiatives -on top of more traditional methods such as focus groups- and also enables us to form several hypotheses as to what could likely work....
Around the executive table, marketing has traditionally had the hardest time proving their value. The correlation between marketing investment and revenue impact has often been fuzzy.
This is particularly true for consumer marketing. When a shopper picks up a particular bottle of shampoo in the grocery aisle, how much of that decision was influenced by marketing? How much of that decision related to years of brand investment, how much to the latest ad, how much to the recent packaging redesign, how much to the placement on shelf, how much to the in-store sales promotion? There are a lot of factors that go into any purchase. How much related to a brand-building message, and how much direct-response? Which tactics should get the credit, and therefore more investment in the future?...
I've been interested in data and analytics for a long, long time. As a ten-year-old, I remember creating Excel spreadsheets with my dad for his annual Fantasy Football pool. By the time I was 16, I was building Pivot Tables with my cell phone bill to figure out who I texted the most. (I promise I had other hobbies.)
Since then, I've learned how much more there is to data analysis besides Pivot Tables and Excel. There's a whole world of analytics out there -- and I've barely scratched the surface.There's always more to learn, so I've made it my mission to learn as much as possible about analytics by talking with people and, of course, consuming as much content as I can online. Here are my favorite go-to resources for continuing my marketing analytics education....
Are you looking for some free books to learn about Data Ming and related topics? Here is an epic list of absolutelly free books on Data Mining...
The problem? Social media is comprised primarily of unstructured data, which is difficult to analyze.
A new approach called Mindset, Skillset, Dataset can help marketers make sense of complex social media data. Mindset refers to the ability to think beyond a certain frame of reference and look at the bigger ‘Why’ of solving a particular problem. Skillset refers to analytical techniques and tools that can be used to solve a particular problem. And Dataset refers to the copious amount of data generated from social media.
The availability of data and skillsets/technique is almost never an issue. Typically, it is the right mindset that’s lacking. Here are some tips for getting in the right frame of mind....
Bob Ross was a consummate teacher. He guided fans along as he painted “happy trees,” “almighty mountains” and “fluffy clouds” over the course of his 11-year television career on his PBS show, “The Joy of Painting.”
In total, Ross painted 381 works on the show, relying on a distinct set of elements, scenes and themes, and thereby providing thousands of data points. I decided to use that data to teach something myself: the important statistical concepts of conditional probability and clustering, as well as a lesson on the limitations of data.
So let’s perm out our hair and get ready to create some happy spreadsheets!...
This is the 2nd post in Data Science introduction, Please go to my 1st post to get started. So, let’s go through a few more examples on Data science.
Clustering Algorithm If you were asked to decide how important a particular scientific paper was relative to other papers, how might you go about doing that?One way to decide between the two papers here, one in light blue and the other in dark blue, is to wait until other papers start to site these, and count up the number of citations...
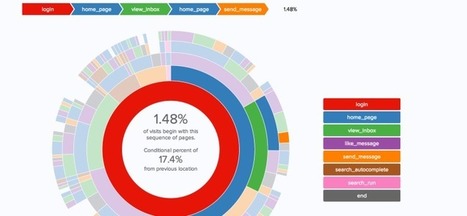
The Mode Playbook is the start of our effort to find out. Each Playbook report includes a SQL query and a visualization. They're built on top of an example users table and event stream—a data structure that's common in many companies. Because users can represent customers, accounts, or users, and events can be logins, purchases, clicks, screen views, or any combination of actions, each Playbook is designed to be flexible enough to fit many different businesses and products. If you have a SQL database with these two concepts, you can make a few simple changes to the reports we provide and have access to the same set of analytical tools we've built over the last year.
|
A new report by ad-tech provider Blue Venn finds that 72% of marketers consider data analysis more important than social media skills. The report, "Customer Data: The Monster Under the Bed?,” incorporates research from 200 U.S. and U.K. marketers, with the goal of identifying the attributes most needed to compete in the data-centric marketing landscape. Key findings include: --Data management is now considered more vital than social media (65%), Web development (31%), graphic design (23%), and search engine optimization (13%). --However, 27% of marketers are still handing over the process of data analysis to IT departments....
Whether you’re making your case for content marketing buy-in or negotiating a bigger budget, it’s all about the stats. Comparing your own analytics to industry figures and survey data from your peers can help guide your content strategy, or provide some insight into tactics you might like to try.
We put together a snapshot of some of the most compelling themes about content marketing in 2015 based on the excellent research conducted by industry leaders, along with suggestions for further reading. Let these content marketing stats serve as a cheat sheet for your own digital marketing research as you forge forward in the New Year....
With an average website visitor conversion rate of just 3%, retailers struggle to convert sales. Online retailers lose an estimated $18 billion in revenueannually due to last-minute cart abandonment. Remarketing, the use of real-time insights to provide targeted recommendations, is just one effective big data methodology that can yield a 55% increase in spend from cart abandoners.
Few industries are more impacted by quickly-changing consumer trends than retail. The complexity of consumer preferences means that big data is “especially promising and differentiating” for organizations in this sector, according to IBM’s Rebecca Shockley and Keith Mercier. In a retail environment where consumers take a multi-channel approach to product selection and purchase, creating a 360-degree view of target customers is particularly critical to retaining business.
62 percent of retailers report that increased adoption of analytics is creating a competitive advantage. While retail adoption of third-party data actually lags slightly behind other industries, retailers who optimize for modern cross-channel shoppers are likely to gain an immense lead. In this article, we’ll explore some ways that modern retailers are utilizing big data insights to understand cross-channel behaviors and create a targeted customer experience....
“95% of data is fluff”
The panel divulged that despite the increasing amounts of data available, only 5% is truly valuable. Tony referred to this as the “95 – 5 rule”, and panelist Ben Jankowski of MasterCard, added, “data ages like fish, not wine.” Therefore, it’s not only important for companies to use the right data, it’s about using it as close to real-time as possible, for maximum success.
Start small, aim big
All panelists agreed big data is great, yet it was clear that it is necessary to start small. It is recommended to take a stepped approach, and find success in each step before continuing to the next. Tony went on to explain that in helping customers use data, the first challenge to overcome is reach. Once you have your hands around that, you can focus and improve upon your creative....
Via Douglas G Hall
What CEOs and the CMOs have come to realize is insights can play a pivotal role in enabling organizations to shift their organization towards customer centricity. Enabling understanding of what customer strategies to implement and how to design marketing effective at connecting with prospective buyers and existing customers.
With the overwhelming amount of data available to corporations, as well as, what can be called the “marketing of insights” by analytics, SaaS, and consulting firms, CEOs, and their teams can get caught in the midst of confusion about what really is a good insight. Confusing it is. We are witnessing top-down big data along with readily available public data broadly categorized as insights. When, in fact, they represent customer information and intelligence gathering organizations have to be good at just to compete....
Blogging is one of the oldest tricks journalists have utilized on the Web to express their opinions and ideas. Even though social networks have been strong competitors, blogs have managed to survive. Are there any good data journalism blogs on the internet? The answer is yes. Here, we give you a list of the blogs you should keep up with in the data realm.
The biggest issue in marketing today, and the one we’re not discussing nearly enough, isn’t so much how to understand data. We can all learn and adapt to that. The biggest issue is that we’re not advancing our processes fast enough to actually put that data to work. According to a recent study by Digiday and Chute, marketers said that mining consumer insights (i.e. collecting data on content viewers) was the number one feature that would save their teams the most time if automated....
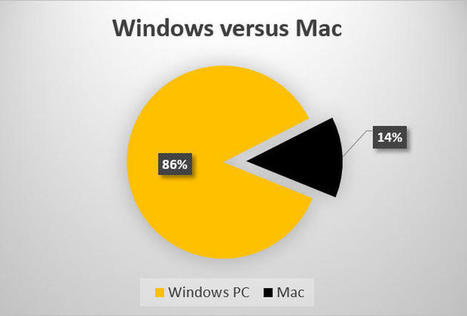
The United States government has given the public access to its massive analytics database, and the results are fascinating. What share does the Mac really have? Is Windows 8.1 a hit or a miss? Who's winning the browser wars? I've dug deep to get the answers....
If you’ve ventured here, you’re probably looking into data science, the mysterious science that seems to verge on mysticism in the press. The virtues of data are constantly praised as innovative and disruptive. They seem like the domain of an exclusive few practitioners lifting numbers into actionable insight.
Harvard Business Review went as far as to saying that the data scientist was the sexiest job of the 21st century.
It seems that data scientists create many of the most exciting projects at the cutting-edge of technology. The people you may know on LinkedIn appear thanks to data mining. Amazon’s book recommendations rely on computers to mine your book preferences and select the one book that is most likely to appeal to you. Facebook finds what posts you like, and serves you more of the same. Google finds out who you are, and filters search results and ads for you....
This post is meant to be a quick tutorial on fourth-down strategy, neatly summarized in the chart above. (You can also read a post that explains the history of me — the NYT 4th Down Bot.).
First, the No. 1 lesson from my 10 years of data analysis about what to do on fourth down: Teams need to go for it much more often than they do. It does get a little complicated toward the end of games, but coaches should almost always consider going for it.In a reasonably close game, and any time until the last 10 minutes of the fourth quarter — when time and score become even more important considerations — here are my recommendations....
By the time you finally submit a payment for an online purchase, chances are good that the seller knows quite a bit about you. Your browsing history reveals all sorts of clues: your interests, which advertisements you’ve been exposed to, and even basic demographics like your probable age range and gender. Just the operating system you use can send significant signals about the prices you’ll tolerate—researchers recently demonstrated that a variety of sites routinely charge more to shoppers using Macs or Android devices.
By comparison, when you make a purchase in a physical store you may as well be anonymous (unless you use a loyalty or membership card). Amongst the unignorable success of companies like Amazon and Alibaba and the exponential growth of e-commerce in general, it’s easy to forget that 75 percent of retail sales still take place in physical stores. And those stores are eager to know just as much about their in-store shoppers as they do about their online shoppers—if not more....
Welcome to Introduction to Data Science. In this first post, I want to go through some examples of data science activities and projects from the recent past that I found interesting. And use them to whet your appetites for the concepts that we are going to learn in the following posts....
|


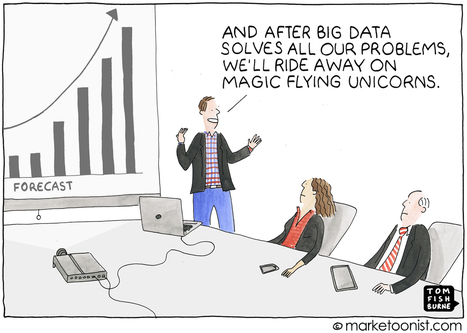


Tom Fishburne remind marketers not to get too big into Big Data.