Research and publish the best content.
Get Started for FREE
Sign up with Facebook Sign up with X
I don't have a Facebook or a X account
Already have an account: Login
Best links and resources for improving practice and proving results.
Curated by
Beth Kanter
 Your new post is loading... Your new post is loading...
 Your new post is loading... Your new post is loading...
|


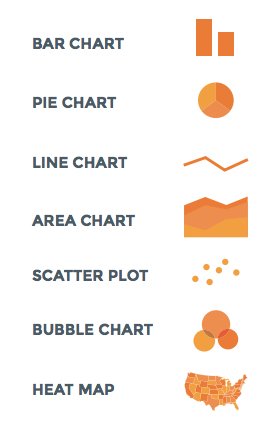
Really useful guide to selecting and designing charts and graphs to visualize your data.