 Your new post is loading...

|
Scooped by
Marteq
|
What are the big spending trends within CMO’s “analytics” bucket?
Two areas stand out in our conversations with marketers:
Customer data platforms
Attribution systems
Any talk of using AI and Analytics in the marketing mix or with digital marketing?
Most definitely. The three most popular areas: marketing-facing analytics, untargeted conversational agents and real-time personalization.
What are 3 to 5 key metrics that you recommend CMOs track?
• ROI of total marketing spend
• Market share versus competition
• Brand health
• Lifetime value to cost-of-customer acquisition cost ratio
• Profitability
|
|
Scooped by
Marteq
|
"Forrester just recently published The Forrester Wave™: Web Analytics, Q4 2017?:
- Modern web analytics technologies now form the core of the digital intelligence stack. Today’s digital practitioners are using their web analytics systems for a lot more including: to aid behavioral targeting & personalization; manage their digital data; integrate it with testing; understand app engagement; and for cross-channel attribution (see Figure 1).
- Web analytics remains the single-most dominate digital intelligence technique. Almost three-quarters of respondents in Forrester’s Q2 2017 Global Digital Intelligence Platforms Forrester Wave™ Customer Reference Online Survey used web analytics from their DI platform providers. Web analytics adoption is significantly greater than the next three dominant digital intelligence techniques which were: application analytics (48%), interaction analytics (43%), and cross-channel attribution (41%).
- Web engagement is still critical to business success. Since the late 90’s, there has been significant shift of digital customer engagement beyond the browser & email (e.g. to mobile apps, social, kiosks and IoT). Yet the clear majority of active internet users still interact via browsers, which remains the most important digital channel for consumers to make online purchases."
|
|
Scooped by
Marteq
|
If you are a marketer, whether at a marketing agency, a brand, or a company, or you're a marketing consultant, you no doubt are always looking for ways to get your clients or company a leg up on the competition. You have Google Analytics experts, dashboards, reports on demand, and more. GA has helped get you to where you are now.
You need answers to the deeper business questions that GA doesn't provide. To gain a comprehensive understanding of a brand's users, personas, and target audience, you need to become an adopter of the next generation of real-time, time-series analytics: behavioral analytics.
With behavioral analytics, you can track the entire user journey via a timeline of events. You see every action on every event you set up to track, whether 1,000 events or a million. These can be mouse hovers, email opens/clicks, CRM activity, and even offline sales. You see not only the actions but also the events between the actions. The moments. This is where you really get an all-encompassing picture of the user journey.
|
|
Scooped by
Marteq
|
1. Gather Detailed Demographics Insights to Address the Right Audience(s)
2. Examine Visitor Behavior to Identify Landing Pages that Need Improvement
3. Review Search Reports to Discover Topic Ideas and Gaps in Coverage
4. Identify New Opportunities for Driving Visitors Deeper into the Purchasing Funnel
5. Analyze Content Reports to Find (and Improve) Failing Content
Three Tools That Provide Unique SEO Website Analysis Opportunities
Crazy Egg—Crazy Egg provides heat maps and scroll maps that allow marketers to see what page components attract the most attention from site visitors, and what parts of the page are most commonly being skimmed or skipped.
SEMrush—SEMrush allows marketers to spy on competitor advertising activities. View competitor PPC and display ad activities, how much they spend, what keywords perform best for them, and what designs and copy work well.
SimilarWeb—SimilarWeb allows marketers to take analytical insights to the next step by seeing competitor analytics and comparing the effectiveness of each business’ marketing strategies.
|
|
Scooped by
Marteq
|
The Best Facebook Analytics Tools
TrackMaven
RavenTools
Cyfe
sociograph
Scoreboard Social
Grytics
SocialPilot
Qwaya
Sociamonials
Plumlytics Social
Keyhole.co
Peakfeed
|
|
Scooped by
Marteq
|
Download the 2017 R2i Web Analytics Comparison Report and research eight of the industry’s leading web analytics systems. COMPARE PLATFORMS BY:
• Reporting & Features • Usability • Integrations • Tag Management • Data Availability • And More
|
|
Scooped by
Marteq
|
The patience for “spray-and-pray” emails is continuing to shrink, and sophisticated B2B buyers are increasingly expecting and demanding relevant and targeted messaging.
In EDRM’s Voice of the Customer research, 73% of the B2B customers surveyed agreed, “For brands or vendors to successfully engage me, they must have a deep understanding of my needs.” The research also showed 66% said they “expect all of [their] interactions with brands or vendors to be personalized.”
Fortunately for B2B marketers, new advancements in real-time data analytics, AI and machine learning are making advanced segmentation and personalization possible, even across complex industries and buying groups.
|
|
Scooped by
Marteq
|
Digital analytics projects are ever changing and dynamic. These characteristics make project management for digital analytics challenging and unique; they are also a key reason why agile methods are appropriate.
The idea of a traditional digital analytics project management is pretty much the same as the Waterfall methodology for software development:
Gather Business Requirements from our stakeholders to define the KPI, metrics and dimension.
Start tagging the website and collecting the required information.
Build reports and do some analysis using those metrics and dimensions. In order, to improve our KPIs. In other words, dive in the depth of an ocean of data to find the rare gem and email or present it with the report as an insight in order to drive actions.
|
|
Scooped by
Marteq
|
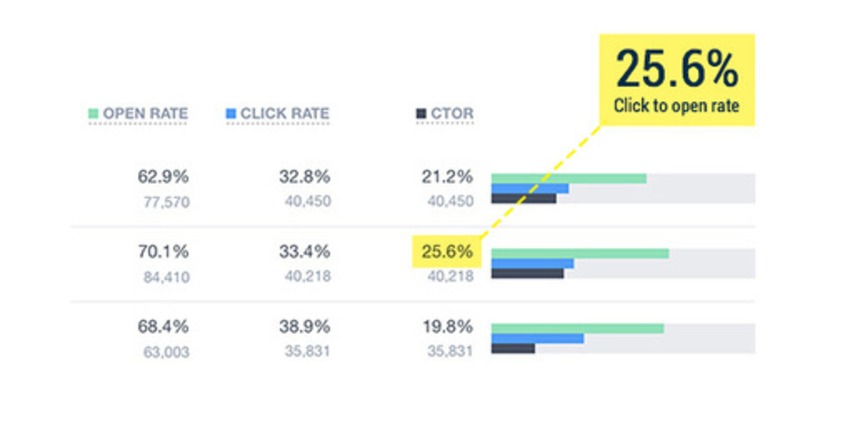
The metric you may not have heard of is click to open rate (CTOR) which essentially measures the effectiveness of the content of your email. It is calculated by the number of unique clicks divided by the number of unique opens.
Using our ongoing example 100 clicks / 180 opens (multiplied by 100 for a percent) = 55%. As with all other email metrics, this can fluctuate based on how awesome your content is. A good CTOR will vary between 20 – 30%.
|
|
Scooped by
Marteq
|
The redesigned Facebook Analytics is one of the most significant updates since the massive algorithm change. Now let’s look at how to navigate the analytics interface to find the information that matters most to you.
#1: Access Your Facebook Analytics
#2: Review Activity Reports
#3: Use Facebook Analytics Data to Inform Your Campaigns
|
|
Scooped by
Marteq
|
"What do we mean by cost optimization? We mean squeezing the best possible ROI from marketing budgets. As a starting point, this means being able to answer the following questions:
- How can I best align my marketing budgets with business goals?
- How can I ensure my budgets are informed by what’s happening in the marketing environment?
- How do I deliver short-term cost efficiency, enabling me to trim extraneous costs without harming longer-term marketing programs?
- How can I Identify longer-term cost efficiencies that deliver sustained benefits to the business?
- How can I build a data-driven, cost conscious culture in the marketing organization that embeds costs efficiency KPIs and metrics across the team?"
|
|
Scooped by
Marteq
|
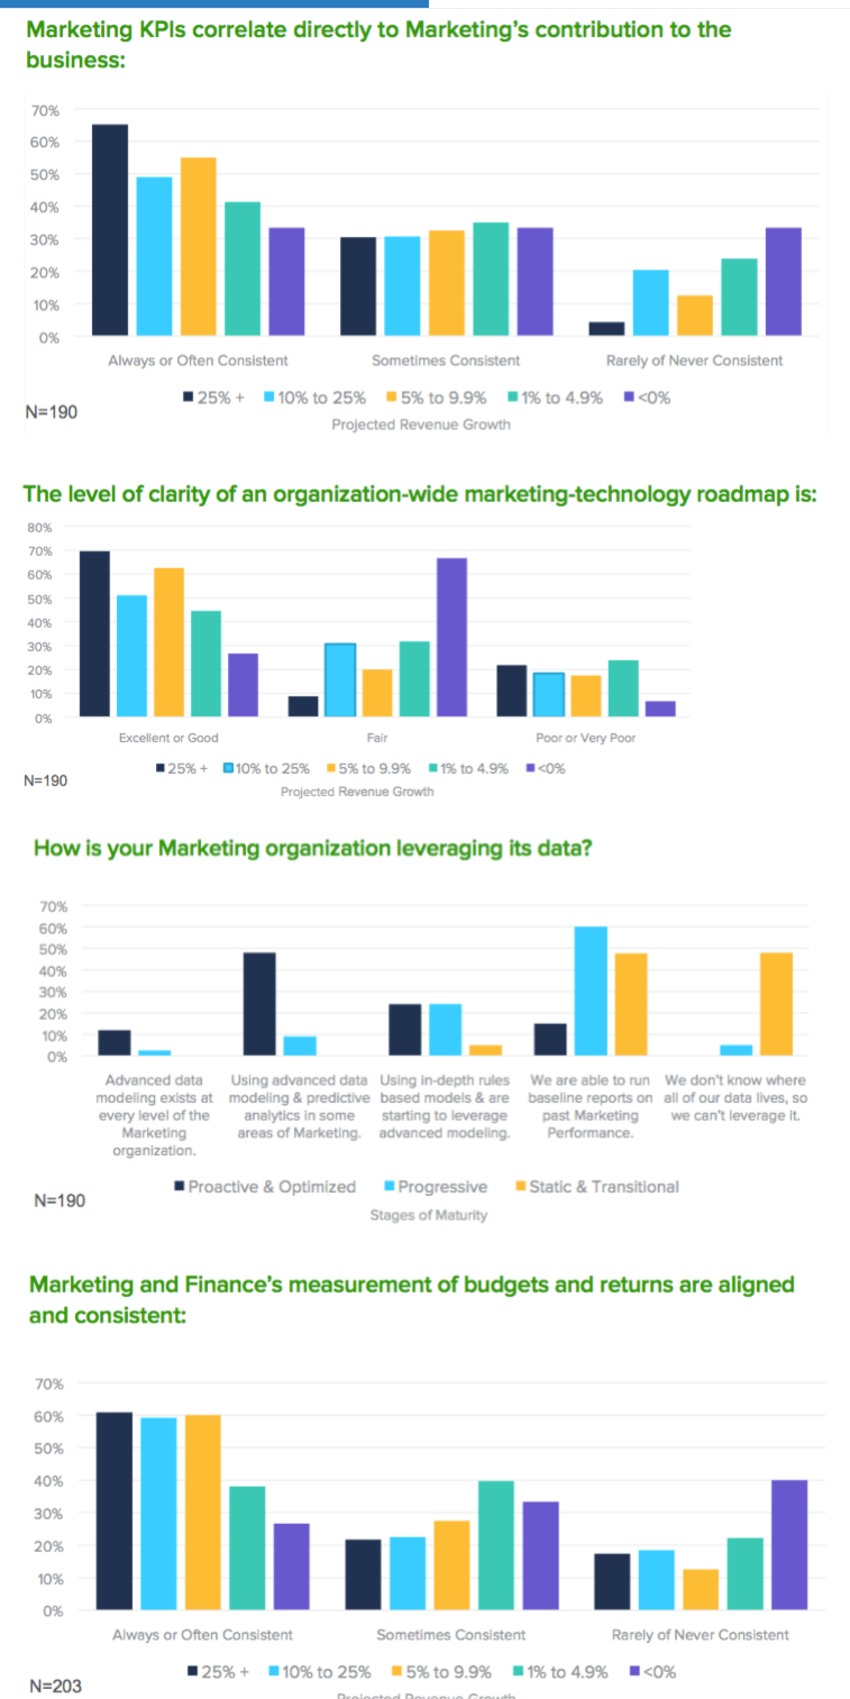
Digital analytics are playing an increasingly important role in helping to drive digital transformation programmes, according to new research published this week by Econsultancy and Lynchpin.
|
|
Scooped by
Marteq
|
For analytics, a full-stack system has to include its own user interface, query engine, persistence and data ingest framework. That is, it has to include functionality for every service on the backend but also have the frontend user interface that makes it usable.
The key here is that good full-stack analytics solutions should be flexible enough to allow you to really get into answering questions with your data. You should be able to do more than just set a few parameters on a funnel, like some out-of-the-box solutions. You should be able to create the metrics you need easily within your analytics interface.
Full-stack analytics also need to be able to scale to your needs with ease. Any good full-stack solution should be able to handle however much data your product and users can throw at it. Having the capacity to scale is crucial for any full-stack solution.
|
|
Scooped by
Marteq
|
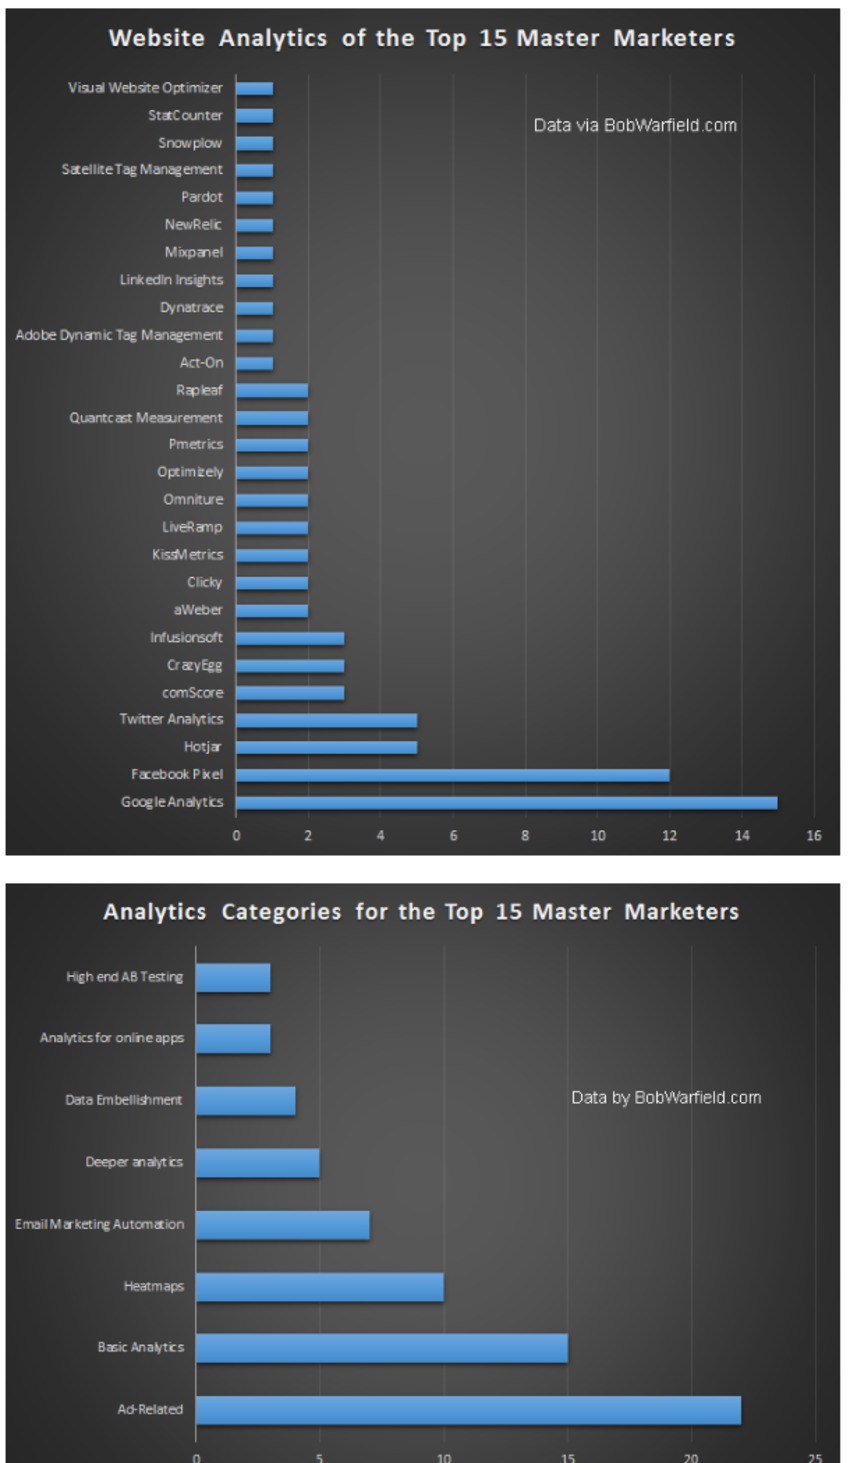
Have you ever stood on the shoulders of giants to see further?
I do every chance I get, at least metaphorically. It’s one reason I’ve been so successful and productive. Why reinvent the wheel if you can have a chance to learn how the giants do it?
|
|
Scooped by
Marteq
|
Content marketing should engage, educate, or entertain, but more importantly, should elicit action. This is what separates content marketing from content publishing.
The goal is not to be good at content, but to be good at business using content. If your content marketing works, it should affect your audience enough to prompt a business-specific behavior. These behavioral actions are the conversions that we need to track in order to see that our content has moved a reader beyond just engagement.
Many desired conversions can be as high-value as lead generation, product purchases, or requests for information. But they can also come in the form of engagement micro-conversions – sharing content, engaging with additional content, exploring your site deeper. What matters is that there are always things you want your reader to do, even if only to continue reading.
|
|
Scooped by
Marteq
|
Here are a few things we learned:
- Marketers are more confident in their metrics.
- Performance marketing measurement is a full-time job.
- Metrics overload is still a problem.
Based on our workshop findings, here’s what we suggest:
- Pick fewer metrics, but ones that have more meaning.
- Connect awareness and consideration metrics with direct response metrics.
- Select technologies that will measure and optimize against your KPIs.
- Pay attention to vendor solutions building pipes into the walled gardens. Marketers are frustrated with sparse data availability from third party providers including the metric calculation opaqueness, leading to outright metrics miscalculations. The good news: more third-party sources are opening their secret garden; Facebook now promotes partnerships with measurement vendors andGoogle just announced its Marketing Mix Model Partners program. Take advantage now and forge these relationships to gain control of your marketing performance data.
|
|
Scooped by
Marteq
|
1. Tableau
2. Cyfe – An all-in-one dashboard to conquer the many moving pieces of your marketing activity.
3. Inspeclet – Make more informed marketing decisions by breaking down user behavior.
4. w3Counter – Emphasizing the importance of real-time data from real-time visitors.
5. Mixpanel – The perfect platform for monitoring mobile marketing.
6. Hotjar – How heatmaps help marketers make crucial decisions.
7. Brand24 – Keeping an eye on buzz for socially-driven brands.
8. GetResponse – Why automated marketing deserves a keen attention to detail.
9. Smart Insights RACE – A practical reporting dashboard that harnesses the power of Google.
10. Google Analytics – The classic standard for analytics still holds its own for modern marketers.
|
|
Scooped by
Marteq
|
CAC = Total Marketing Costs (TMC) / Total New Customers (TNC)
When measuring for content marketing, your TMC should include the cost of the content itself (what you paid the writer and/or graphic designer and/or video producer, your salary costs (how much did you pay your staff to publish, distribute, promote, and monitor, and the tech costs (the fees for the services, tools, and platforms used)
CLV [Historic] = (T1 + T2 + T3…+ Tn) * AGM
To find your (simple) predictive CLV—arguably the more valuable figure—try this formula:
CLV [Predictive] = ((T x AOV) * AGM) * ALM
...where T is the average number of monthly transactions, AOV is the average order value, ALM is the average customer lifespan in months, and AGM is the average gross margin.
ROI = (CLV - CAC) / CAC
So, a lifetime value of $200 with an acquisition cost of $50 yields an ROI of 300% [(200-50) / 50 = 3, or 300%].
|
|
Scooped by
Marteq
|
Here’s how the CMO can help ensure the success of the team’s measurement efforts.
- Pave the way.
- Remove roadblocks.
- Provide conflict resolution.
- Guide and validate visualization of the data.
- Refine the process.
- Monitor the efforts.
|
|
Scooped by
Marteq
|
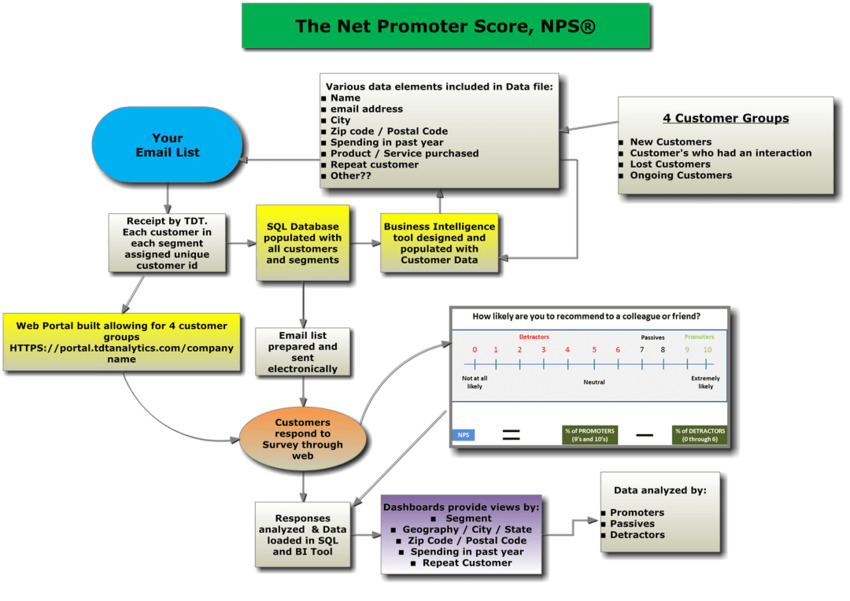
1. Optimize CX:
NPS tracked across the customer journey highlights the areas which are not valued by customers (which otherwise you thought was valuable). Hence, understanding the drivers of NPS, from customer perspective, helps in prioritizing the CX and hence optimize cost.
2. Overall Health Check:
NPS mapped across the customer journey helps organizations get a bird’s eye view of their entire operation.This helps to compare performance of processes and understand which process could be the weakest link.
3. Touchpoint specific feedback:
NPS mapped across the journey will highlight challenges specific to each step of the customer lifecycle. With techniques such as advanced text analytics, it is possible to get to the root of specific problems at each stage quickly.
4. Quicker Close Looping:
If there is a problem with a specific process, NPS mapped across the customer journey helps to close loop it faster without delay or impacting other processes.
5. Bridge gaps between different department:
NPS across the customer journey helps to bridge any gap between these departments and strengthen synergies.
|
|
Scooped by
Marteq
|
|
|
Scooped by
Marteq
|
- Combine an enterprise-wide analytics strategy with resources for individual business units
- Bring together business and technical people to define high-value analytics initiatives and develop project road maps
- Delineate clear milestones and track KPIs based on business requirements, then continuously measure the success of analytics investments
- Choose integrated analytics platforms that address local and enterprise-wide requirements versus collections of point solutions
- Evaluate the cost-savings and advanced capabilities possible with cloud-based analytics options
|
|
Scooped by
Marteq
|
|
|
Scooped by
Marteq
|
"Any combination of analytics, math, experiments, simulation, and/or artificial intelligence used to improve the effectiveness of decisions made by humans or by decision logic embedded in applications."
Prescriptive Analytics Inform And Evolve Decision Logic Whether To Act (not not act) And What Action To Take
Prescriptive analytics can be used in two ways:
■ Inform decision logic with analytics. Decision logic needs data as an input to make the decision. The veracity and timeliness of data will insure that the decision logic will operate as expected. It doesn’t matter if the decision logic is that of a person or embedded in an application — in both cases, prescriptive analytics provides the input to the process.
■ Evolve decision logic. Decision logic must evolve to improve or maintain its effectiveness. In some cases, decision logic itself may be flawed or degrade over time. Measuring and analyzing the effectiveness or ineffectiveness of enterprises decisions allows developers to refine or redo decision logic to make it even better.
|
|
Scooped by
Marteq
|
To build a strategy around your analytics (instead of the reverse), follow these tips:
- Learn to live with being wrong. Part of letting the data drive your strategy is letting go of initiatives that simply don’t move the needle (or move the needle enough to justify the investment).
- Approach data from a number of angles. There are likely a number of ways to interpret your marketing data, so bring in a partner or a few to help make sense of it all and ensure you aren’t missing any key perspectives.
- Test, and test some more. Marketing analytics give you a picture of how things are – to find out how things could be, you’ll need to test your tactics and theories.
- Above all, listen. At the end of the day, the number one mistake you can make is to ignore what all of your valuable analytics are telling you. Let the data speak for itself, and listen.
|
|


![Analytics play a key role in helping to drive digital transformation [New research] | The MarTech Digest | Scoop.it](https://img.scoop.it/HftCEvS607Fgopx7dGnQdvL6dadsvGA8m9WNoVsbzkY=)


CDPs and real attribution. Otherwise, kiss MarTech ownership goodbye.
Click/tap to view the original article.
This news comes to you compliments of marketingIO.com. #MarTech #DigitalMarketing