 Your new post is loading...

|
Scooped by
Marteq
|
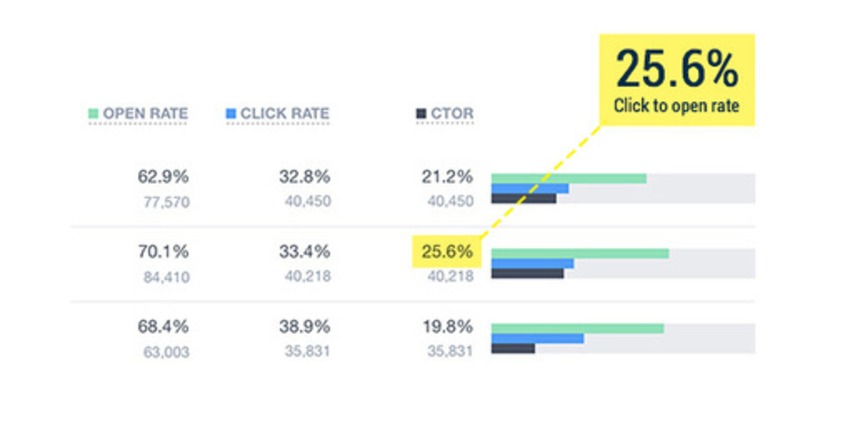
The metric you may not have heard of is click to open rate (CTOR) which essentially measures the effectiveness of the content of your email. It is calculated by the number of unique clicks divided by the number of unique opens.
Using our ongoing example 100 clicks / 180 opens (multiplied by 100 for a percent) = 55%. As with all other email metrics, this can fluctuate based on how awesome your content is. A good CTOR will vary between 20 – 30%.
|
|
Scooped by
Marteq
|
"What do we mean by cost optimization? We mean squeezing the best possible ROI from marketing budgets. As a starting point, this means being able to answer the following questions:
- How can I best align my marketing budgets with business goals?
- How can I ensure my budgets are informed by what’s happening in the marketing environment?
- How do I deliver short-term cost efficiency, enabling me to trim extraneous costs without harming longer-term marketing programs?
- How can I Identify longer-term cost efficiencies that deliver sustained benefits to the business?
- How can I build a data-driven, cost conscious culture in the marketing organization that embeds costs efficiency KPIs and metrics across the team?"
|
|
Scooped by
Marteq
|
|
|
Scooped by
Marteq
|
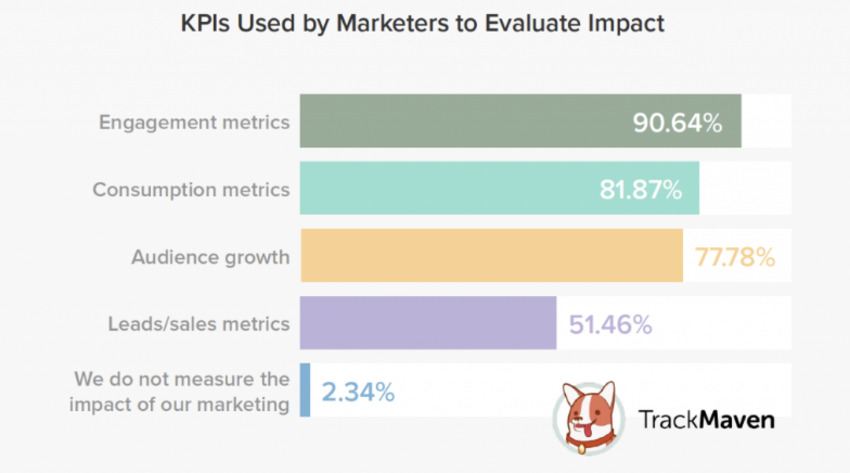
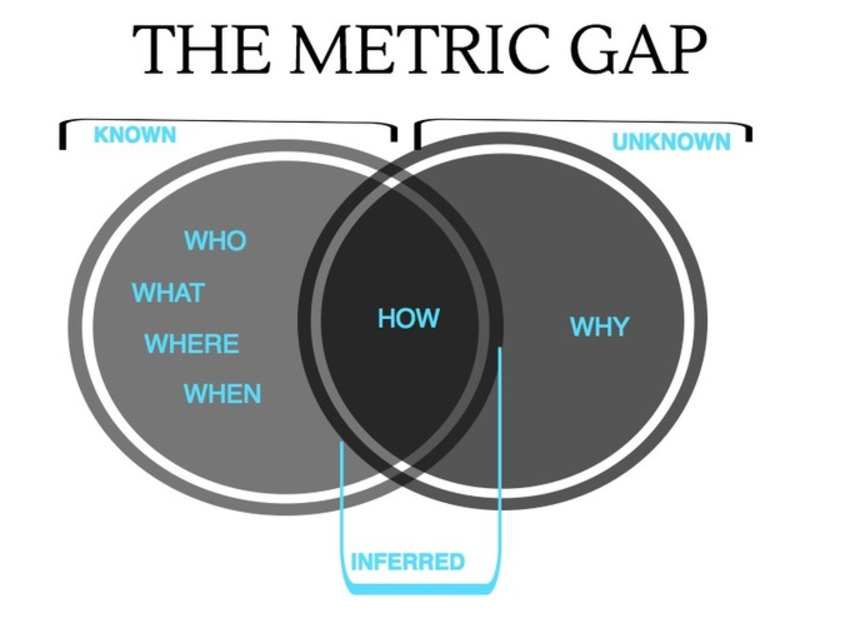
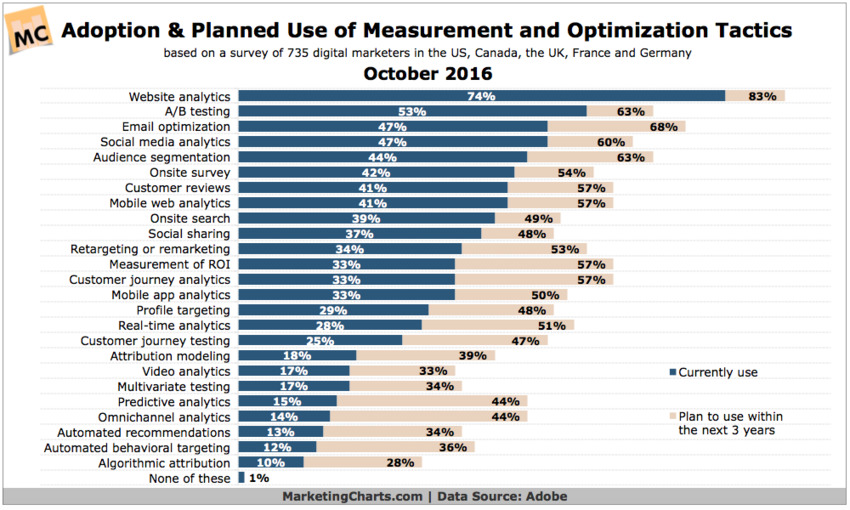
Chart of the Day: The vast majority of marketers are still using vanity metrics to assess content effectiveness, whilst only half are measuring the effect. Marketing topic(s):Content marketing management. Advice by Robert Allen.
|
|
Scooped by
Marteq
|
|
|
Scooped by
Marteq
|
Here are a few things we learned:
- Marketers are more confident in their metrics.
- Performance marketing measurement is a full-time job.
- Metrics overload is still a problem.
Based on our workshop findings, here’s what we suggest:
- Pick fewer metrics, but ones that have more meaning.
- Connect awareness and consideration metrics with direct response metrics.
- Select technologies that will measure and optimize against your KPIs.
- Pay attention to vendor solutions building pipes into the walled gardens. Marketers are frustrated with sparse data availability from third party providers including the metric calculation opaqueness, leading to outright metrics miscalculations. The good news: more third-party sources are opening their secret garden; Facebook now promotes partnerships with measurement vendors andGoogle just announced its Marketing Mix Model Partners program. Take advantage now and forge these relationships to gain control of your marketing performance data.
|
|
Scooped by
Marteq
|
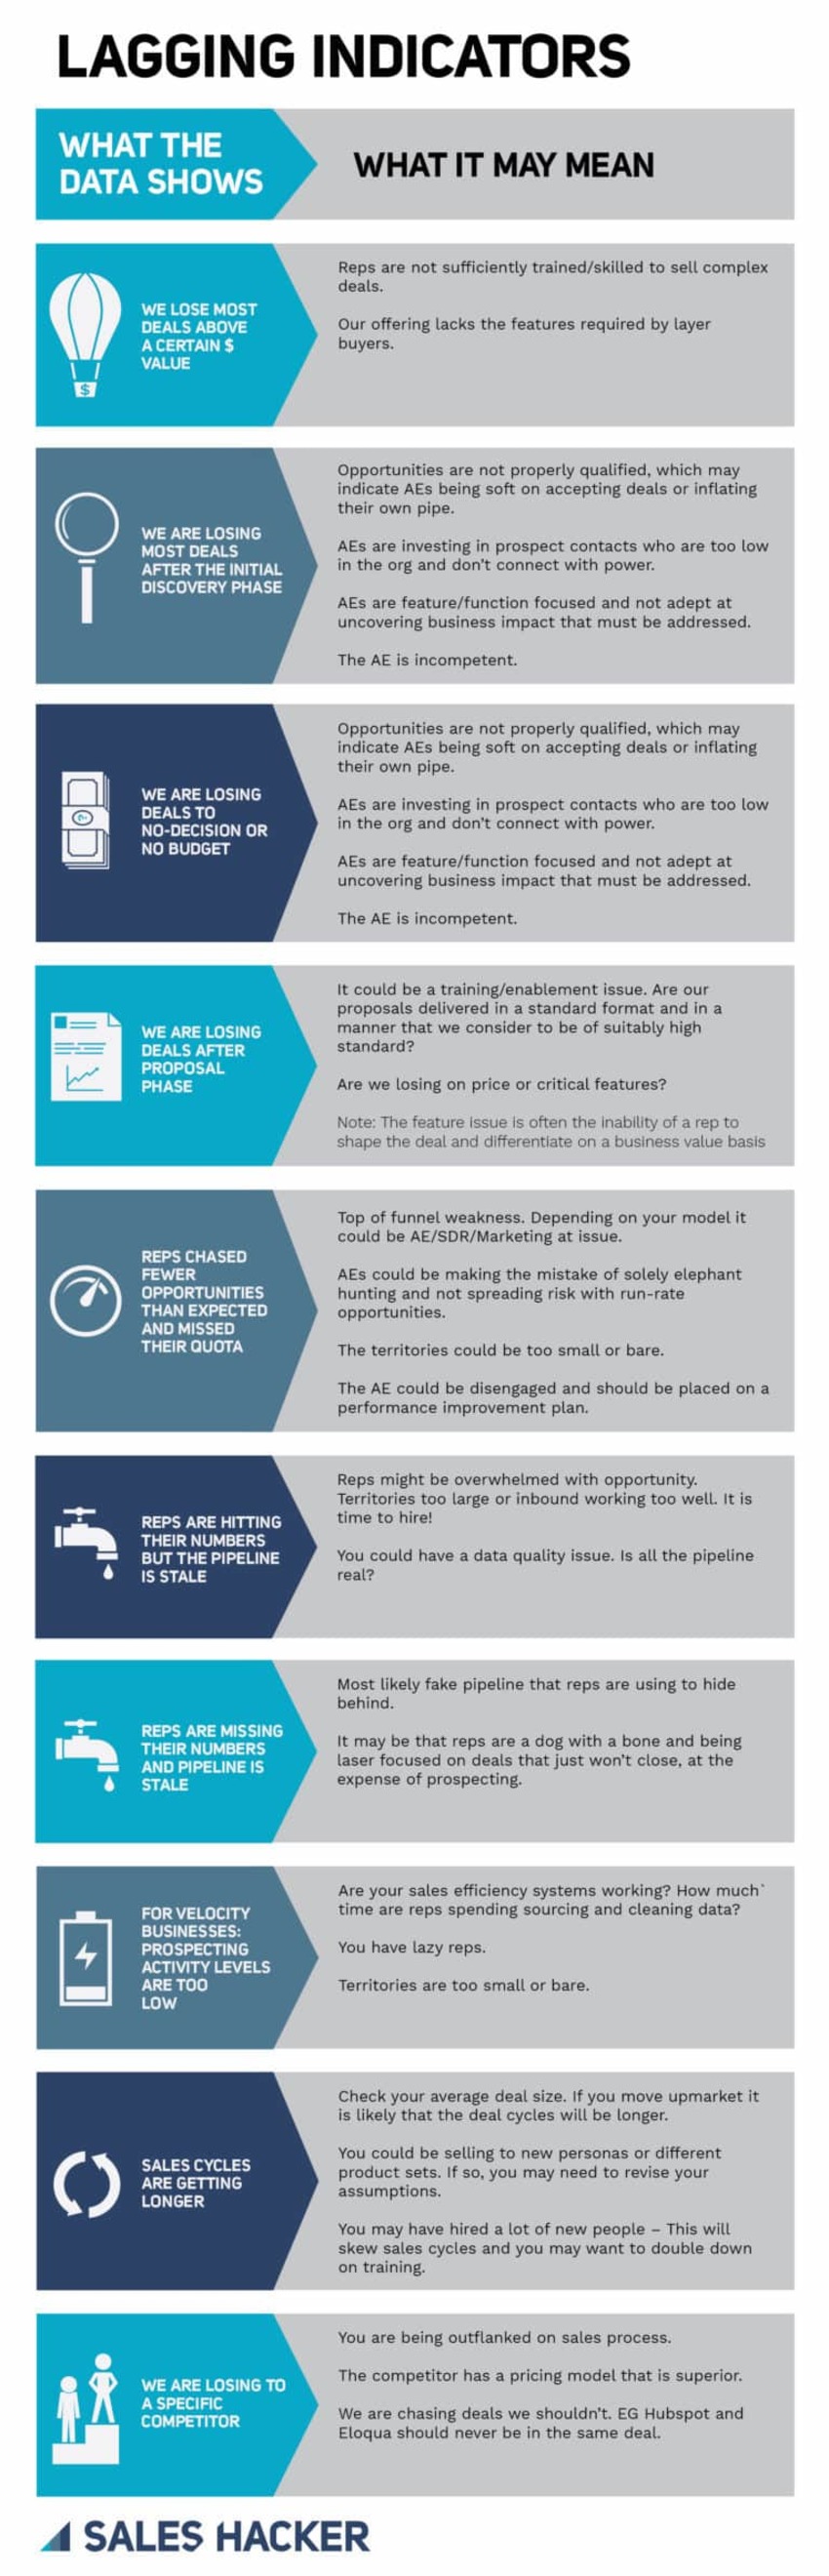
Whether you're a sales leader in SMB or Enterprise, follow our sales metrics cheat sheet to guide your organization to success.
|
|
Scooped by
Marteq
|
CAC = Total Marketing Costs (TMC) / Total New Customers (TNC)
When measuring for content marketing, your TMC should include the cost of the content itself (what you paid the writer and/or graphic designer and/or video producer, your salary costs (how much did you pay your staff to publish, distribute, promote, and monitor, and the tech costs (the fees for the services, tools, and platforms used)
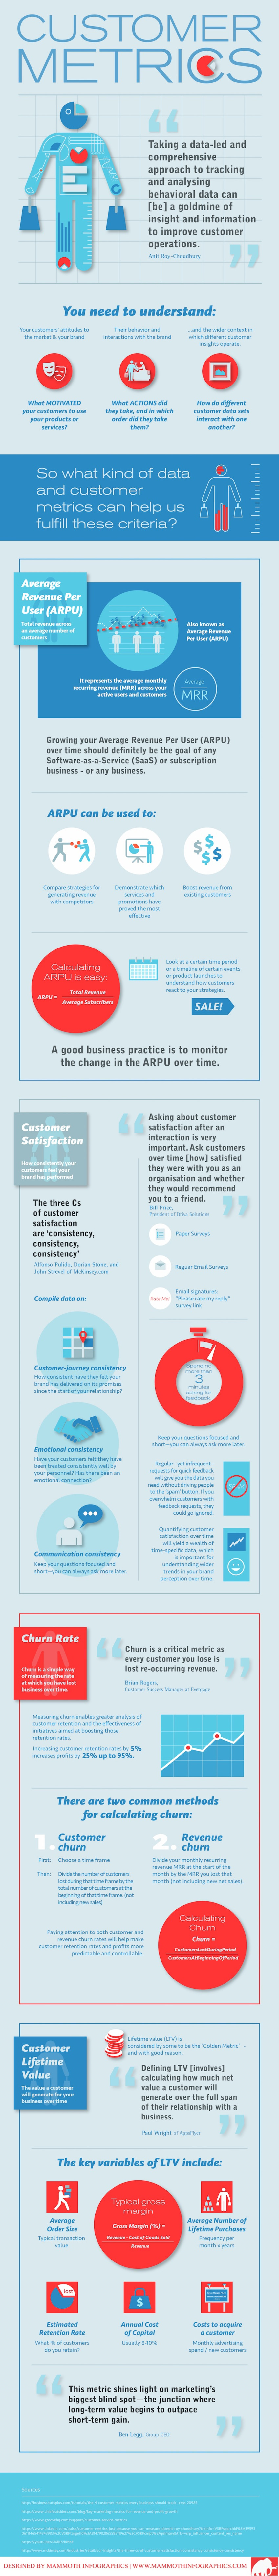
CLV [Historic] = (T1 + T2 + T3…+ Tn) * AGM
To find your (simple) predictive CLV—arguably the more valuable figure—try this formula:
CLV [Predictive] = ((T x AOV) * AGM) * ALM
...where T is the average number of monthly transactions, AOV is the average order value, ALM is the average customer lifespan in months, and AGM is the average gross margin.
ROI = (CLV - CAC) / CAC
So, a lifetime value of $200 with an acquisition cost of $50 yields an ROI of 300% [(200-50) / 50 = 3, or 300%].
|
|
Scooped by
Marteq
|
1. Don’t just prove ROI. Improve It.
2. Align Sales and Marketing
3. Document Your Content Strategy Plan (and Know Your KPIs)
4. Measure the Health of Content Production
5. In 2017, Account-Based Marketing (ABM) Will Be the Key Metric for Measuring Marketing Success
6. Predictive Analytics Will Evolve
7. Customization is Key
8. Score
9. Use a Content Metrics Dashboard
10. Ramp Up Measurement of Mid and Late-Funnel Engagement
|
|
Scooped by
Marteq
|
Lead Source Metrics
% Marketing Sourced Leads
% Sales Sourced Leads
Conversion Rate Metrics
Marketing Lead to Customer Rate
Sales Lead to Customer Rate
Revenue Contribution Metrics
% Revenue From Marketing Sourced Leads
% Revenue From Sales Sourced Leads
Product/Service Adoption
|
|
Scooped by
Marteq
|
The research revealed attribution — assigning credit or allocating dollars from a sale to specific pre-purchase marketing touchpoints — has grown to an increasingly important top-of-mind topic for marketers.
It also found industry professionals have intensified their interest in marketing measurement, "specifically, better evaluating their efforts and optimizing their decision process."
This year, 67 percent of marketers said they plan to shift away from first- or last-click attribution models to other alternatives, including blended attribution.
|
|
Scooped by
Marteq
|
- Linear attribution: This is the simplest of the multi-touch attribution models. It evenly applies credit to all touchpoints in the buyer’s journey.
- Time decay attribution: This model assigns more credit to touchpoints closest to the point of sale. Its weakness is that it will never give proper credit to top-of-funnel touches because they will always be furthest from the conversion.
- Position-based attribution: This model focuses on lead generation. It emphasizes two particular touchpoints: the first touch and the lead conversion touch. The rest of the credit is distributed evenly among the remaining touchpoints.
- W-shaped attribution: This model is a variant of position-based attribution, but prioritizes an additional third touchpoint for when a prospect becomes an opportunity.
- Z-shaped attribution: Z-shaped attribution takes the w-model further by adding a final touchpoint: customer close. This attribution works best if your organization continues to market to existing sales prospects, and there is close cooperation between our sales and marketing teams.
- Social and content attribution: This social-focused attribution model connects top-of-funnel interactions to bottom-funnel conversions on your website and landing pages.
|
|
Scooped by
Marteq
|
|
|
Scooped by
Marteq
|
Let’s dive into some key B2B lead conversion-tracking methods for win-win clarity.
1. Lifecycle Stages
2. Source & Cost Attribution
3. Goal Ramp Incorporation
4. Monthly Recurring Revenue per SQL
5. Months to Payback
6. Multiple views of the above data
|
|
Scooped by
Marteq
|
- CLICK-THROUGH-RATES ON EMAIL MARKETING CAMPAIGNS
- CONVERSION RATES
- VALUE OF SITE INTERACTION
- SOCIAL SHARES
- ROI
|
|
Scooped by
Marteq
|
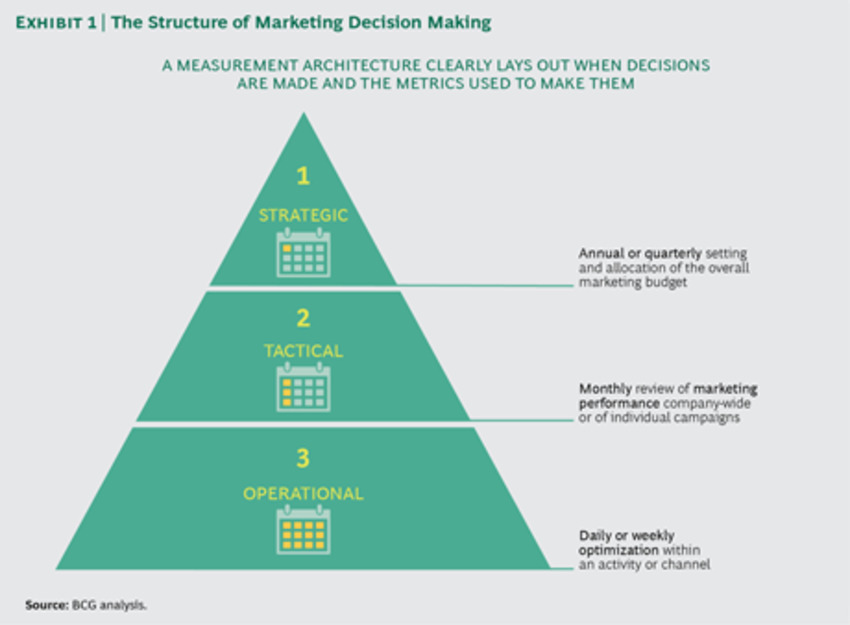
"Any marketing department will benefit from a common measurement architecture—a decision-making framework used across the organization that matches a set of appropriate metrics (and by extension analytical tools and techniques, such as response modeling, brand tracking, and competitive benchmarking) with the most frequent marketing decisions. The measurement architecture helps sidestep another common pitfall: the tyranny of random facts, a common corporate phenomenon in which different marketing managers each cite a fact or data point revealed by some unique tool or model as evidence of the great job they are doing. It’s not that the facts are wrong; they may be totally valid. However, there is no clear way to compare one fact with another or even to know whether they are appropriate reference points for the issue at hand.
In our view, there are three types of marketing decision—strategic, tactical, and operational—that are typically made at different levels of the organization and according to different calendars. (See Exhibit 1.) Strategic decisions tend to involve the significant reallocation of marketing budgets and take place as part of the fiscal budgeting cycle. Tactical decisions typically occur many times throughout the year; they are course corrections for campaign spending levels, mix, timing, and messaging. Operational decisions, such as those concerning particular media or channels, can occur daily—or even hourly in today’s increasingly digital context. In addition, the availability of near-real-time data shifts much of a company’s focus to short-term operational priorities, which can upset the necessary balance between a short- and longer-term view of overall marketing strategy and objectives.
A measurement architecture provides marketers with a framework that defeats the tyranny of random facts by laying out which marketing decisions should be made at which time, based on which metrics, and fed by which tools and data. Once such an architecture is established, it becomes relatively straightforward to develop the analytical infrastructure to bring it to life across the entire organization. We find that many of our clients are increasingly able to focus on how to use software platforms to put data, tools, and insights into the hands of marketing decision makers at each level of the measurement architecture across brands and markets around the world."
|
|
Scooped by
Marteq
|
By 2016, something profound had happened. More and more clients talked about how they were moving away from MQLs and looking more at opportunities and revenue. Some of this was due to predictive lead scoring , and some of it was probably because of ABM, where you think about accounts, rather than leads. But some of it was simply because CMOs and demand generation leaders had convinced sales and executive leadership that revenue is a far more important metric than leads. And so when clients asked me about how they increase their MQLs by 30% YOY, they were much more receptive to hearing why they were barking up the wrong tree.
If you are a demand gen or marketing leader (or a BU leader or executive who manages them) and the metrics haven’t been set for 2017, I’d think long and hard about some other more important metrics. If you are doing ABM, you can always look to Engagio’s Marketing Qualified Account (MQA) approach or something akin to it. Or you can tie to company or product-line sales metrics like revenue, pipeline, opportunities, deal size, retention etc; At the end of the day, if you blow out your MQL numbers but the company misses on those downstream numbers, you aren’t going to get a huge bonus or promotion. So why not hitch your wagon to the only numbers that truly matter to the company?
|
|
Scooped by
Marteq
|
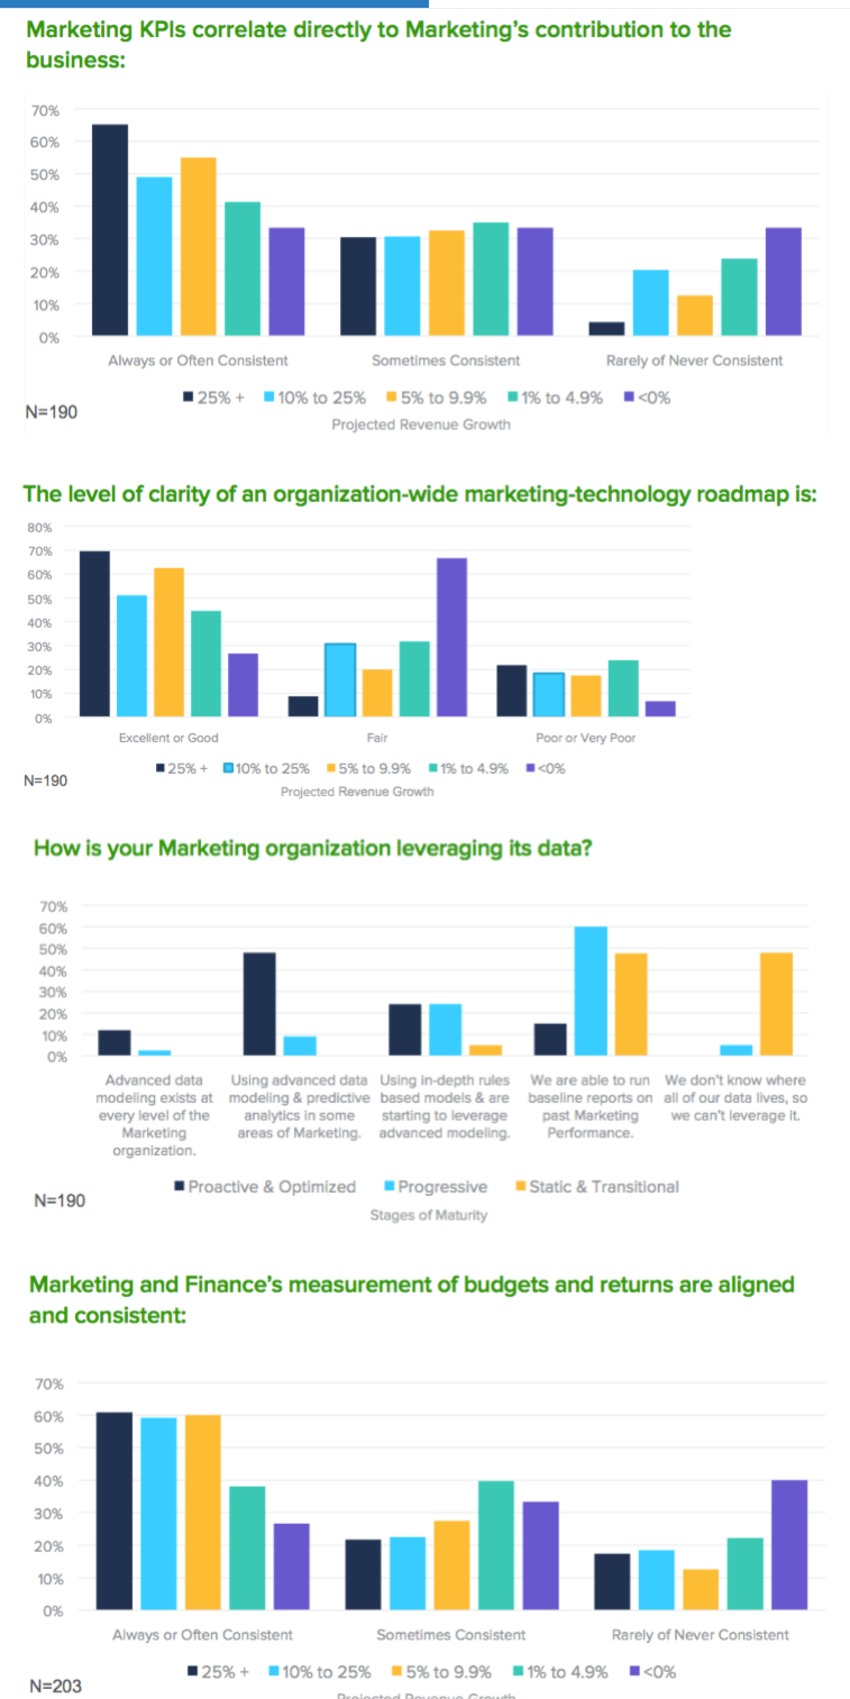
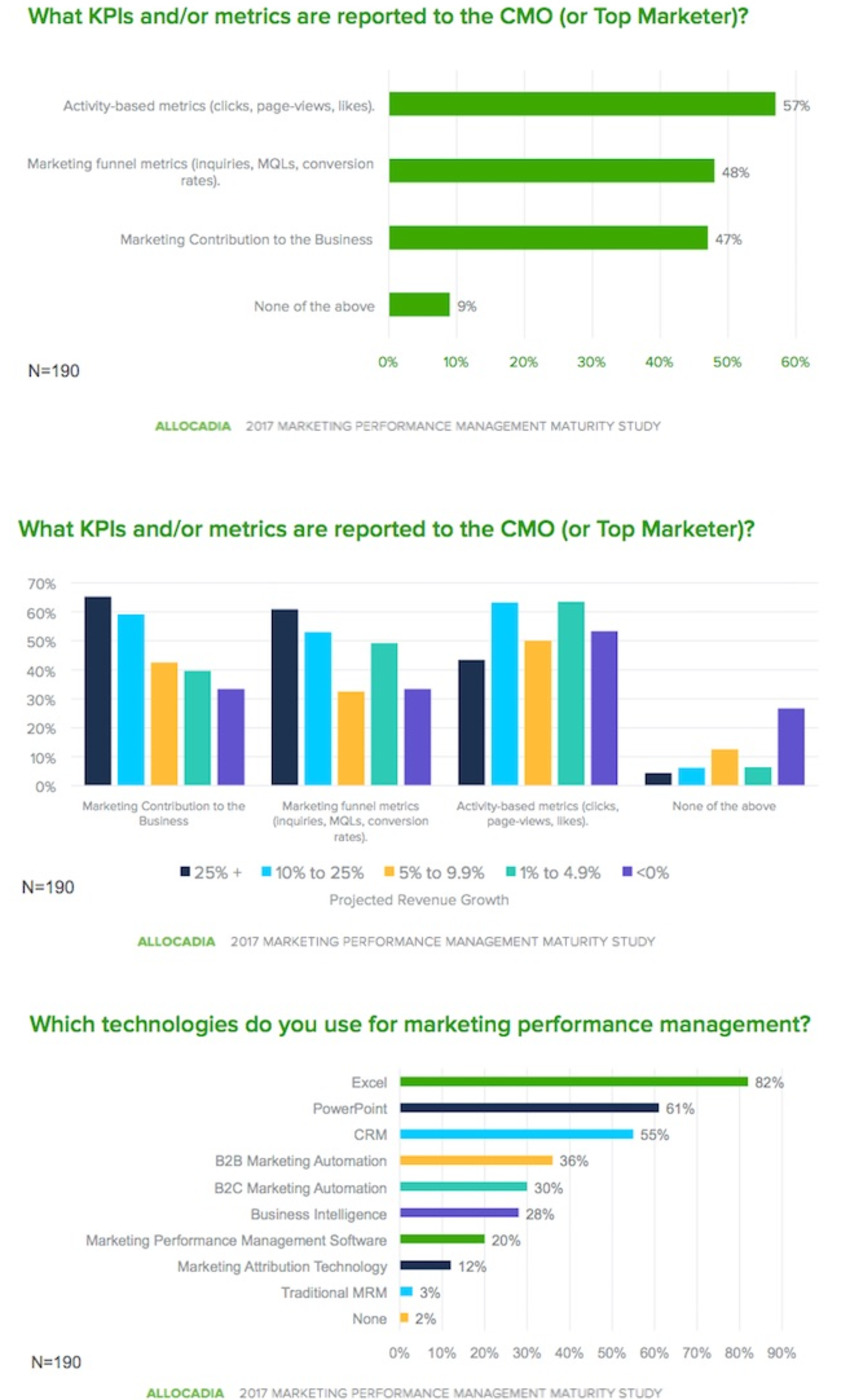
To measure marketing performance, CMOs and top marketers of high-performing brands use KPIs and metrics that measure Marketing's contribution to sales and the business. Check out the stats here.
|
|
Scooped by
Marteq
|
Marketers will be more accountable than ever. The mindset shift means moving beyond the KPIs we have been used to and connecting the dots across from strategy to execution to performance. This means starting with the business goals and tracing the path to determine the key variables that lead to those goals. It also means injecting more information to better inform communication strategies:
- Qualified leads: Use behavioral and social data to verify prospect leads and identify false positives.
- Enrich customer profiles: leverage behavioral and profiling information to enhance knowledge about your customers.
- Machine learning will also enable scoring systems to develop best-fit models that define audience segments, product matches, affinities and customer value.
- Developing an end-to-end accountable framework: Acquisition to retention will require continuous optimizations based on updated market and customer data to improve performance.
|
|
Scooped by
Marteq
|
Of course, to know what you’re doing well, you need metrics. With 2017 upon us, there’s never been a better time to revisit how your company uses analytics. Whether you’re looking to launch a new website or get better results from your current pages, here are some of the most important metrics you should consider tracking when it comes to growth in the new year.
1. Blog Traffic
2. Click-Through Rates
3. Social Reach
4. Time on Site
5. Traffic Sources
|
|
Scooped by
Marteq
|
Dashboards can and should be customizable for each business’s unique marketing goals. It serves as a way for marketing teams and their leaders to track their progress toward goals and ROI, as well as a way for marketing leaders to attribute marketing activities to business outcomes. This is especially important for CMOs, who can be the first to get fired if a company fails to hit its growth goals.
Dashboards should be flexible, to accommodate different business needs and changing strategies. Metrics can be separated out into digital marketing dashboards, campaign dashboards, and more. However, there are several essential metrics and KPIs every CMO dashboard should include for B2C and B2B companies.
|
|
Scooped by
Marteq
|
|
|
Scooped by
Marteq
|
Adoption of unified marketing impact analytics (UMIA) is growing as marketers prioritize creating a data-driven approach to marketing investment decisions and realize the importance of maintaining a 360-degree view of customer interactions.
UMIA requires buy-in and coordination from all corners of the organization. This report specifically maps out how the internal marketing, customer analytics, technology, and finance organizations, along with third-party partners should divvy up responsibility in tackling marketing measurement.
|
|
Scooped by
Marteq
|
1. Always Start by Setting Your Objective(s)
2. Define Your Data Model
Now that you set your objective(s), it’s critical to make sure you have the data you need in order to report the success of your campaign or program. If you don’t have the data, you won’t be able to report back to your business that the investment made will deliver positive ROI. The good news is, you can start small and refine it as you become more sophisticated in your segmentation and targeting strategies. Going back to the re-engagement program, in order to report on whether you achieved the objective set, you’ll need to be able to identify and flag the inactive group prior to shipping your campaign out of the door.
3. Define the Metrics & KPIs
4. Develop a Reporting Plan (Align Reports x Stakeholders)
5. Don’t Forget to Capture Your Learnings
|
|
Scooped by
Marteq
|
|
|


Subscribe to The MarTech Digest: http://bit.ly/miocom #MarTech