The MarTech Digest
563.4K views | +1 today
Follow
Your new post is loading...
Scooped by Marteq
Scoop.it!

Types of Infographics | CM ontwerp | #TheMarketingAutomationAlert

Types of Infographics |  CM ontwerp | #TheMarketingAutomationAlert | The MarTech Digest | Scoop.it
Your story of idea contains data. This data converted in design = infographic. Showing the different types of infographics.


__________________________________

NEW: iNeoMarketing makes content marketing easy with the new Q8 Content. Q8 fills your content pipeline daily with relevant articles that your audience wants to read. Learn more and sign up for the beta program: http://www.Q8content.com.


Receive a FREE daily summary of The Marketing Technology Alert directly to your inbox. To subscribe, please go to http://ineomarketing.com/About_The_MAR_Sub.html  (your privacy is protected).

Marteq's insight:

You'll want to bookmark this if you're active in infographics, or desire to be active. It's not a terribly complex list, but it covers the basics.

No comment yet.
Scooped by Marteq
Scoop.it!

The Truth About Visual Content Marketing Tactics: Infographics | #TheMarketingAutomationAlert

The Truth About Visual Content Marketing Tactics: Infographics | #TheMarketingAutomationAlert | The MarTech Digest | Scoop.it

Key excerpts...


Remember, data is the foundation of every infographic, so when you have a dataset on hand, take the time to learn what it’s about, where it’s from, the methodology behind the estimates and what makes it interesting and unique. According to statistics gathered by Hubspot, consider that

-- >  90% of information transmitted to the brain is visual

-- >  Visuals are processed 60,000X faster in the brain than text

-- >  40% of people will respond better to visual information than plain text


Infographic Best Practices

-- >  Write a catchy title. (Easier said than done.)

-- >  Choose an interesting vs. ‘hot’ topic that resonates with your customers’ needs.

-- >  Be topical. Check Google trends for trending topics relevant to your industry and/or target audience.

-- >  Involve credible sources in the data collection, such as prominent companies, people or research organizations, and then encourage those sources to help you promote the resulting graphic.

-- >  Promote vial social channels and make it easy to share or embed by including HTML code.

-- >  On the resized image page, try and insert text to help with search engine crawlers and include social sharing buttons above and below the infographic.

-- >  Avoid a white background or too much text. Infographics are often shared on multiple websites and blogs, most of which have white backgrounds. If your infographic’s background is also white, then deciphering where it begins and ends will be difficult.

-- >  Link to a larger image of the graphic to a page with no formatting for a better user experience.

-- >  List references of research sources you’ve cited, which will increase the perceived value of your efforts.


__________________________________

NEW: iNeoMarketing makes content marketing easy with the new Q8 Content. Q8 fills your content pipeline daily with relevant articles that your audience wants to read. Learn more and sign up for the beta program: http://www.Q8content.com.


Receive a FREE daily summary of The Marketing Technology Alert directly to your inbox. To subscribe, please go to http://ineomarketing.com/About_The_MAR_Sub.html  (your privacy is protected).


Marteq's insight:

The truth is self-evident. If staff has the bandwidth, or you have the budget, infographics are sensible, long lasting, and sociable.

No comment yet.
Scooped by Marteq
Scoop.it!

Video Infographic: Your Brain on Visualization - KISSmetrics | #TheMarketingAutomationAlert

http://blog.kissmetrics.com - In this video we go over the known benefits of using infographics for content marketing. A big thanks to Bryan Harris of VideoFruit for making this awesome video!


___________________________________

-Receive a FREE daily summary of The Marketing Technology Alert directly to your inbox. To subscribe, please go to http://ineomarketing.com/About_The_MAR_Sub.html  (your privacy is protected).

-If you like this scoop from The Marketing Technology Alert (brought to you by iNeoMarketing), PLEASE share by using the links below.


Marteq's insight:

The article can be found here: http://blog.kissmetrics.com/your-brain-on-visualization.


It's a no-brainer, and when you think about it, every paper, fact sheet, etc. should be converted over to an infographic.

Moo-Young Jay Kim's curator insight, October 28, 2013 7:30 PM

Visualization, why it matters...

Scooped by Marteq
Scoop.it!

What Makes an Infographic Bad & How To Make It Better by Vertical Measures | #TheMarketingAutomationAlert

What Makes an Infographic Bad & How To Make It Better by Vertical Measures | #TheMarketingAutomationAlert | The MarTech Digest | Scoop.it
Whether you are creating infographics yourself or working with a designer, these basic principles will help build the basic structures for a clear and clean infographic that will let your content shine!
Marteq's insight:

h/t to Digital Information World


  • See the article at from www.verticalmeasures.com
  • Receive a daily summary of The Marketing Automation Alert directly to your inbox. Subscribe here (your privacy is protected).
  • If you like this scoop, PLEASE share by using the links below.
  • iNeoMarketing drives more revenue and opportunities for B2B companies using marketing technologies. Contact us
No comment yet.
Scooped by Marteq
Scoop.it!

Going Social: The State of Video in 2013 - Uberflip | #TheMarketingAutomationAlert

In this videographic, Uberflip explores the state of video as a cross-platform marketing tool. How popular is online video? How much are marketers spending o...
Marteq's insight:

Some time ago, I read a trilogy called The Lanchester Strategy by Shinichi Yano, and the three books were completely done in comic book fashion. Two factors were impressive: the Strategy itself (which to this day I cannot figure out why it has not taken off in the U.S.), and the ease in which the subject matter was communicated.


Fast forward to infographics. By combining left and right brain processing, I think we can agree that information is more easily communicated in this fashion vs. copy with charts. Now think about the aforementioned video, which is an animated infographic with a sound track. Even more entertaining and impactful.


How close are we to cartoons? Incredibly close. My bet is that we're going to see an explosion of cartoon animation to communicate complex topics. Here's a perfect example: remember Jurassic Park? Remember how the topic of DNA cloning was communicated? As a cartoon! Easy for the moviegoer to understand and retain? You bet!


Are you a comic book illustrator? REPOSITION YOURSELF! Just make sure you publicly thank me for the tip.


  • See the article at From www.youtube.com
  • Receive a daily summary of The Marketing Automation Alert directly to your inbox. Subscribe here (your privacy is protected).
  • If you like this scoop, PLEASE share by using the links below.
  • iNeoMarketing drives more revenue and opportunities for B2B companies using marketing technologies. Contact us
No comment yet.
Scooped by Marteq
Scoop.it!

This is Your Brain on Visualization - QuickSprout | #TheMarketingAutomationAlert

This is Your Brain on Visualization - QuickSprout | #TheMarketingAutomationAlert | The MarTech Digest | Scoop.it

But did you know visualizations such as infographics are thirty times more likely to be read than text? And if that’s not enough to convince you to start using visualizations within your marketing, maybe this infographic will change your mind.

Marteq's insight:
  • See the article at www.quicksprout.com
  • Receive a daily summary of The Marketing Automation Alert directly to your inbox. Subscribe here (your privacy is protected).
  • If you like this scoop, PLEASE share by using the links below.
  • iNeoMarketing drives more revenue and opportunities for B2B companies using marketing technologies. Contact us
No comment yet.
Scooped by Marteq
Scoop.it!

[INFOGRAPHIC] 10 Rules About Infographics | Avalanche Infographics | #TheMarketingAutomationAlert

[INFOGRAPHIC] 10 Rules About Infographics | Avalanche Infographics | #TheMarketingAutomationAlert | The MarTech Digest | Scoop.it
Information + Story + Design = Infographics. This is how the equation may be written to prove the success and legitimacy of this steeply upward slopin
Marteq's insight:
  • See the article at visual.ly
  • Receive a daily summary of The Marketing Automation Alert directly to your inbox. Subscribe here (your privacy is protected).
  • If you like this scoop, PLEASE share by using the links below.
  • iNeoMarketing drives more revenue and opportunities for B2B companies using marketing technologies. Contact us
Scooped by Marteq
Scoop.it!

SlideShare Introduces Support for Infographics, a Big Win for Marketers - HubSpot | #TheMarketingAutomationAlert

SlideShare Introduces Support for Infographics, a Big Win for Marketers - HubSpot | #TheMarketingAutomationAlert | The MarTech Digest | Scoop.it
Get the low-down on SlideShare's newest feature and a few takeaways to improve your marketing.


Excerpt...


This morning, SlideShare announced an exciting new feature: users can now include fully optimized infographics on their SlideShare accounts. Before, users could technically upload infographics as a document, but the viewing player wasn't optimized properly for the content. We're thrilled about this new feature. Finally, one of the hottest types of visual content will be easy to upload, view, embed, and share from SlideShare! 

Marteq's insight:

We alluded to this earlier this week, but HubSpot covered the announcement, so if you're using infographics, this is important news. The bigger picture: SlideShare continues to grow as a powerful tool for the B2B marketer, and must NOT be overlooked.


  • See the article at blog.hubspot.com
  • Receive a daily summary of The Marketing Automation Alert directly to your inbox. Subscribe here (your privacy is protected).
  • If you like this scoop, PLEASE share by using the links below.
  • iNeoMarketing drives more revenue and opportunities for B2B companies using marketing technologies. Contact us


No comment yet.
Scooped by Marteq
Scoop.it!

Looks Matter: Attracting Customers with Infographics - Brafton

Looks Matter: Attracting Customers with Infographics - Brafton | The MarTech Digest | Scoop.it
You want to attract the right business matches to drive profitable relationships, and our graphic shares data exploring how branded infographics can help.
Marteq's insight:
  • See the article www.brafton.com
  • Receive a daily summary of The Marketing Automation Alert directly to your inbox. Subscribe here (your privacy is protected).
  • If you like this scoop, PLEASE share by using the links below.
  • iNeoMarketing drives more revenue and opportunities for B2B companies using marketing technologies. Contact us
Marteq's comment, July 2, 2013 4:55 PM
Yet another coffee table book on coffee tables.
Scooped by Marteq
Scoop.it!

Custom infographics drive clicks, Tweets and links for SEO [data] - Brafton

Custom infographics drive clicks, Tweets and links for SEO [data] - Brafton | The MarTech Digest | Scoop.it
A recent case study suggests that infographic marketing outperforms display advertising by 300 percent.


Key excerpt...


U.S. businesses already embrace infographic content for lead generation. According to the Content Marketing Institute, 38 percent of B2Bs and 33 percent of B2Cs use these graphics to turn written blog content into clickable and shareable images. Site visitors who engage with infographics are likely to share them on their social profiles or email them to friends or colleagues. All of this drives website conversions.

Marteq's insight:

We enjoy infographics: it's a fun way to communicate with your audience, and indeed it is very sharable. Make no mistake: they're a pain to create (no matter how many people tell you otherwise), but worth it as they can be leveraged over a variety of channels. NOTE: we firmly believe that we are close to communicating via comic books/strips/anime.


  • See the article at www.brafton.com
  • Receive a daily summary of The Marketing Automation Alert directly to your inbox. Subscribe here (your privacy is protected).
  • If you like this scoop, PLEASE share by using the links below.
  • iNeoMarketing merges marketing automation with content marketing for a powerful lead management solution, configured and managed by our knowledgeable, experienced staff.  Contact us.
nancy pekala's curator insight, May 3, 2013 10:45 AM

Disagree with so many marketers who think infographics is a fad.  Infographics blend data and custom content in a way that drives engagement and sharing.

Scooped by Marteq
Scoop.it!

10 Tools and Resources for Creating Quality Infographics and Presentations | Business 2 Community

10 Tools and Resources for Creating Quality Infographics and Presentations | Business 2 Community | The MarTech Digest | Scoop.it
In a recent article published on AllTwitter, it was revealed that content that contains infographics is 832% more likely to be shared than content that contains just images and text. In other words, infographics can be very powerful for getting more social media shares and exposure.
Summarized...
Marteq's insight:

What we're really interested in are tools for Infographics 2.0.


  • See the article at www.business2community.com
  • Receive a daily summary of The Marketing Automation Alert directly to your inbox. Subscribe here (your privacy is protected).
  • If you like this scoop, PLEASE share by using the links below.
  • iNeoMarketing merges marketing automation with content marketing for a powerful lead management solution, configured and managed by our knowledgeable, experienced staff.  Contact us.
No comment yet.
Scooped by Marteq
Scoop.it!

Which infographic is right for you? - Econsultancy

Which infographic is right for you? - Econsultancy | The MarTech Digest | Scoop.it
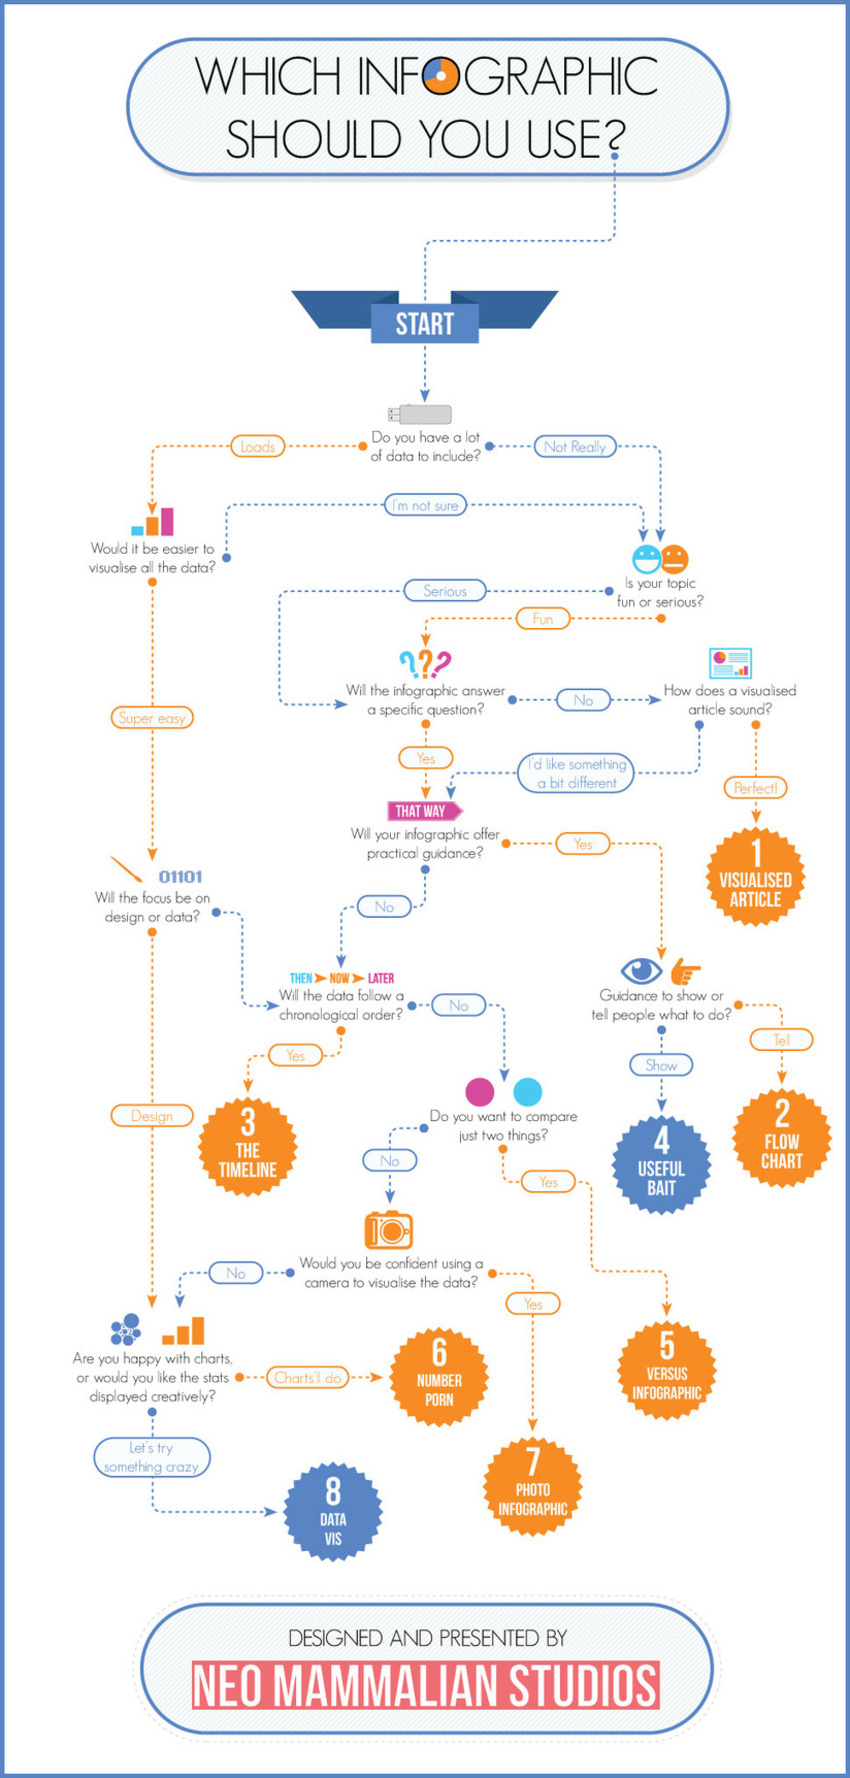
That’s right, there’s more to infographics than a scrolling image full of facts and figures. Different types of infographics are consumed differently.
Marteq's insight:
  • See the article at econsultancy.com
  • Receive a daily summary of The Marketing Automation Alert directly to your inbox. Subscribe here (your privacy is protected).
  • If you like this scoop, PLEASE share by using the links below.
  • iNeoMarketing merges marketing automation with content marketing for a powerful lead management solution, configured and managed by our knowledgeable, experienced staff.  Contact us.
No comment yet.
Scooped by Marteq
Scoop.it!

FREE: Your Google Analytics Presented as an Infographic - Visual.ly

FREE: Your Google Analytics Presented as an Infographic - Visual.ly | The MarTech Digest | Scoop.it
Marteq's insight:

This is very cool...and FREE! Have your Google Analytics account compiled and presented as an Infographic each week!


  • See the article at https://create.visual.ly/graphic/google-analytics/
  • Receive a daily summary of The Marketing Automation Alert directly to your inbox. Subscribe here (your privacy is protected).
  • If you like this scoop, PLEASE share by using the links below.
  • iNeoMarketing merges marketing automation with content marketing for a powerful lead management solution, configured and managed by our knowledgeable, experienced staff.  Contact us.


Evangelos Zirdelis's curator insight, March 25, 2013 9:50 AM
Simple infographics for presentations with Google Analytics data
Scooped by Marteq
Scoop.it!

How to create the perfect infographic - Econsultancy

How to create the perfect infographic - Econsultancy | The MarTech Digest | Scoop.it
Once a fun and useful way of presenting data in an easy-to-digest format, infographics have been overused to the point that their reputation is close to ruin.


Topline...


The five basic steps are:

  • Find some data. Infographics require useful, accurate data, so you need to search online to find it.
  • Sort the data. Check through the data to make sure that it’s high quality and relevant to your topic.
  • Arrange the data. Use the data to create a narrative.
  • Present the data. You need to create a readable infographic that guides people through the data.
  • Share the data. Get the infographic out there so people start linking back to your client’s site.
Marteq's insight:

Each step is explained within the article, and on the heels of the adjacent HBR blog scoop, you'll want to click through to review.


  • See the article at econsultancy.com
  • Receive a daily summary of The Marketing Automation Alert directly to your inbox. Subscribe here (your privacy is protected).
  • If you like this scoop, PLEASE share by using the links below.
  • iNeoMarketing merges marketing automation with content marketing for a powerful lead management solution, configured and managed by our knowledgeable, experienced staff.  Contact us.
No comment yet.
Scooped by Marteq
Scoop.it!

We've Reached Peak Infographic, and We're No Smarter for It - HBR Blog

We've Reached Peak Infographic, and We're No Smarter for It - HBR Blog | The MarTech Digest | Scoop.it
It's time to acknowledge the shortcomings of infographics as much as we celebrate their upsides.


Key snippet...


It's time we acknowledge the shortcomings of infographics as much as we celebrate their upsides. That's harder to do now that infographics have exploded as a cottage industry within design. The boom began in 2006 with the launch of GOOD magazine, my former employer, which emphasized infographics from the start and was named a National Magazine Award finalist for its work in 2008. Fast Company and Wired entered the game. Today, entire design studios are dedicated to creating these illustrative data dumps.


Since leaving my job earlier this year, I've had the opportunity to create infographics on a freelance basis for several publications. When I speak to potential clients, I often realize that they're more interested in churning out the form than in telling a story. An idea without supporting data; a list; a business plan; a resume — none of these are infographics, no matter what they're labeled. And even if the data exists, just because you can create an infographic doesn't mean you should.

Marteq's insight:

We're seeing the same: infographics created for the sake of infographics. They play an important role so long as they are built with the same degree of detail as any other content marketing piece, e.g., we toil over white papers, but do we toil to the same degree over infographics. Sidebar: we're still waiting for B2B comic books (not kidding!).


  • See the article at blogs.hbr.org
  • Receive a daily summary of The Marketing Automation Alert directly to your inbox. Subscribe here (your privacy is protected).
  • If you like this scoop, PLEASE share by using the links below.
  • iNeoMarketing merges marketing automation with content marketing for a powerful lead management solution, configured and managed by our knowledgeable, experienced staff.  Contact us.
No comment yet.
Scooped by Marteq
Scoop.it!

Five exceptional interactive infographics and why they worked - Econsultancy

Five exceptional interactive infographics and why they worked - Econsultancy | The MarTech Digest | Scoop.it

The bar for infographic quality has been raised. After three years of brands from every niche jumping onto the trend, it’s become increasingly difficult for infographics to stand out and gain the attention they promised back in 2010.


Infographics are still effective, they just need to be extra creative or interesting to work effectively in 2013. One increasingly popular solution for added creativity is to make the infographics interactive using HTML5 and JavaScript.

Marteq's insight:

This is the second infographic scooped article in as many days pertaining to infographics.Take a look at the examples, and see how you can turbo-boost your infographics.


  • See the article at econsultancy.com
  • Receive a daily summary of The Marketing Automation Alert directly to your inbox. Subscribe here (your privacy is protected).
  • If you like this scoop, PLEASE share by using the links below.
  • iNeoMarketing merges marketing automation with content marketing for a powerful lead management solution, configured and managed by our knowledgeable, experienced staff.  Contact us


No comment yet.
Scooped by Marteq
Scoop.it!

5 Infographics to Teach You How to Easily Create Infographics in PowerPoint [+ TEMPLATES] - HubSpot

5 Infographics to Teach You How to Easily Create Infographics in PowerPoint [+ TEMPLATES] - HubSpot | The MarTech Digest | Scoop.it
5 infographics and free templates that will teach you how to easily create professional-looking infographics in PowerPoint.
Marteq's insight:

We're not scooping all five infographics, but definitely want you to click through should you want to find an easy way to create infographics in PowerPoint. You'll want to bookmark this one!


  • See the article at blog.hubspot.com
  • Receive a daily summary of The Marketing Automation Alert directly to your inbox. Subscribe here (your privacy is protected).
  • If you like this scoop, PLEASE share by using the links below.
  • iNeoMarketing merges marketing automation with content marketing for a powerful lead management solution, configured and managed by our knowledgeable, experienced staff.  Contact us
No comment yet.
Scooped by Marteq
Scoop.it!

FREE: Marketing with Infographics: A New Pardot White Paper

FREE: Marketing with Infographics: A New Pardot White Paper | The MarTech Digest | Scoop.it

With so many other projects vying for the modern marketer’s attention, it can be hard to track down all the information required to craft the perfect infographic strategy. It is for this reason that we have created our new white paper, “Marketing with Infographics: A Complete Guide for Marketers,” to help plan, implement, and optimize infographics in your marketing strategy.

Marteq's insight:

Free white paper for download. How about an infographic about infographics in addition to the white paper? Reminds us of this.


  • See the article at www.pardot.com
  • Receive a daily summary of The Marketing Automation Alert directly to your inbox. Subscribe here (your privacy is protected).
  • If you like this scoop, PLEASE share by using the links below.
  • iNeoMarketing merges marketing automation with content marketing for a powerful lead management solution, configured and managed by our knowledgeable, experienced staff.  Contact us
No comment yet.
Scooped by Marteq
Scoop.it!

The true colour of brands and true nature of infographics | Futurelab

The true colour of brands and true nature of infographics | Futurelab | The MarTech Digest | Scoop.it

Important take-aways...


Infographics, mostly those like this one which are beautiful and laid out with excellent taste, go straight to the point and are easy to grasp. They are emotional and aesthetic. They appeal to our feelings. Besides because they are so simple and didactic, they are taken at face value, so much so that no one dares point out that they could be wrong. All you need is a click of the mouse and hey presto! The picture is multiplied and shared throughout the world. It is no longer cogito but imago ergo sum.


Yet, infographics are also simplistic and exaggerated. They save time but at the same time, pictures tend to deprive readers from their critical eye. Most of the time they are non representative and show surprising results. They often refer to “a study the world’s top 100…” (Brands in this particular case) but who selected the sample? What are those brands? Who commissioned the study? Where are the results to be found? What methodology?… Such questions are and will remain, most probably, unanswered.


Marteq's insight:

Great justification for the use of infographics. Yes, color influences, but this article more than validates the use of infographics.


  • See the article at www.futurelab.net
  • Receive a daily summary of The Marketing Automation Alert directly to your inbox. Subscribe here (your privacy is protected).
  • If you like this scoop, PLEASE share by using the links below.
  • iNeoMarketing merges marketing automation with content marketing for a powerful lead management solution, configured and managed by our knowledgeable, experienced staff.  Contact us
No comment yet.
Scooped by Marteq
Scoop.it!

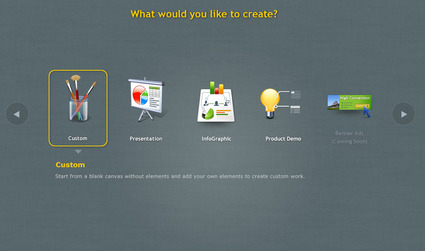
10 Tools for Creating Infographics and Visualizations - SEOmoz

10 Tools for Creating Infographics and Visualizations - SEOmoz | The MarTech Digest | Scoop.it

Here's the list of tools compiled by SEOmoz:


1. Piktochart

2. Easel.ly

3. Infogr.am

4. Visual.ly

5. Tableau

6. OmniGraffle

7. Basalmiq

8. RSA Animate series 

9. TimelineJS

10. Present.me


Marteq's insight:

What a great compilation!  It includes tools to create video, infographics, wireframes, etc.  BOOKMARK THIS ONE!


  • See the article at www.seomoz.org
  • Receive a daily summary of The Marketing Automation Alert directly to your inbox. Subscribe here (your privacy is protected).
  • If you like this scoop, PLEASE share by using the links below.
  • iNeoMarketing merges marketing automation with content marketing for a powerful lead management solution, configured and managed by our knowledgeable, experienced staff.  Contact us
No comment yet.
Scooped by Marteq
Scoop.it!

Become a content marketing all star. Part one: Graphadelic - Econsultancy

Become a content marketing all star. Part one: Graphadelic - Econsultancy | The MarTech Digest | Scoop.it
In this post, I'll discuss the best practices for obtaining content, naming and organizing content, and finally marketing your graphic content.
Marteq's insight:

Great article that delves into the details behind not only creating the visuals that are a vital part of the content marketing strategy, but how to organize and market the graphic content so that it is optimized for search!  Well worth it to click through for the details.


  • See the article at econsultancy.com
  • Receive a daily summary of The Marketing Automation Alert directly to your inbox. Subscribe here (your privacy is protected).
  • If you like this scoop, PLEASE share by using the links below.
  • iNeoMarketing merges marketing automation with content marketing for a powerful lead management solution, configured and managed by our knowledgeable, experienced staff.  Contact us
No comment yet.
Scooped by Marteq
Scoop.it!

Making Good Infographics: Planning, Teams, Data and Designers [Infographic]

Making Good Infographics: Planning, Teams, Data and Designers [Infographic] | The MarTech Digest | Scoop.it

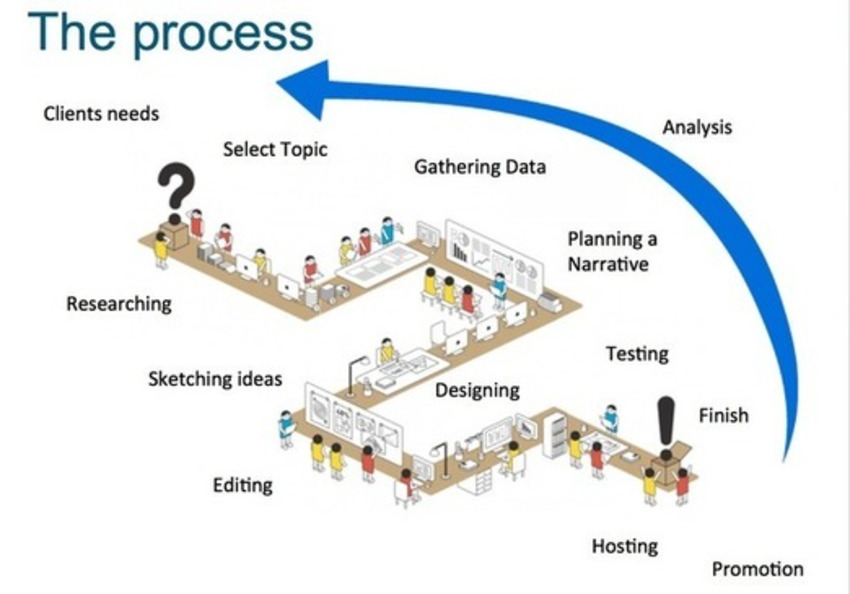
Another Coffee Table Book on Coffee Tables (Q: who wrote that book?).  A good backgrounder on the creation of infographics...


Marteq's insight:


  • Receive a daily summary of The Marketing Automation Alert directly to your inbox. Subscribe here (your privacy is protected).


  • If you like this scoop, PLEASE share by using the links below.


  • iNeoMarketing merges marketing automation with content marketing for a powerful lead management solution, configured and managed by our knowledgeable, experienced staff.  Contact us
No comment yet.
Scooped by Marteq
Scoop.it!

State of Infographics [INFOGRAPHIC] or a Coffee Table Book on Coffee Tables

State of Infographics [INFOGRAPHIC] or a Coffee Table Book on Coffee Tables | The MarTech Digest | Scoop.it
Marteq's insight:

See the article at www.topmarketingschools.net.


Receive a daily summary of The Marketing Automation Alert directly to your inbox. Subscribe here (your privacy is protected). If you like this scoop, please share by using the links below.


iNeoMarketing merges marketing automation with content marketing for a powerful lead management solution, configured and managed by our knowledgeable, experienced staff.  Contact us.

No comment yet.
Scooped by Marteq
Scoop.it!

Three Simple Infographic Builders

We all know that images are worth a thousand words, but to content publishers, infographics are worth higher engagement rates:

Easel.ly: http://www.easel.ly/

Infogr.am: http://infogr.am/

Piktochart: http://piktochart.com/

No comment yet.
Scooped by Marteq
Scoop.it!

Beyond Infographics: 12 Ways to Visualize Data

Beyond Infographics: 12 Ways to Visualize Data | The MarTech Digest | Scoop.it

Let's look beyond the basic pie charts and infographics to explore other techniques and tools that can help visualize data. Who knows whether one of these tools or techniques will become as popular as the infographic (IG) is today...

No comment yet.