


Research and publish the best content.
Get Started for FREE
Sign up with Facebook Sign up with X
I don't have a Facebook or a X account
Already have an account: Login

Daily Magazine
320.2K views |
+15 today
If it's Innovation it's here! https://officialandreascy.blogspot.com
Curated by
THE OFFICIAL ANDREASCY
 Your new post is loading...
 Your new post is loading...
Your new post is loading...
|
Robin Good: David McCandlees, the author of the book Information is Beautiful celebrates great data visualization and information design work through the Information is Beautiful Awards.
» Data visualization– A singular visualisation of data or information.» Infographic – Using multiple data visualisations in service to a theme or story
» Interactive visualization – Any viz where you can dynamically filter or explore the data.
» Data journalism – A combination of text and visualizations in a journalistic format.
» Motion infographic – Moving and animated visualizations along a theme or story.
» Tool or website – Online tools & apps to aid datavizzing.
The selection itself is worth a tour of the site and of this initiative.
Check: http://www.informationisbeautifulawards.com/
Longlist selection: http://www.informationisbeautifulawards.com/2012/07/our-longlist/
Shortlist selection: http://www.informationisbeautifulawards.com/2012/08/awardshortlist/
Via Robin Good 
|


This is another post where I recommend that you scroll down to have a look at Robin Good's great commentary. I can not beat his for details. His Scoop.it site is: http://curation.masternewmedia.org/ Thanks Robin!
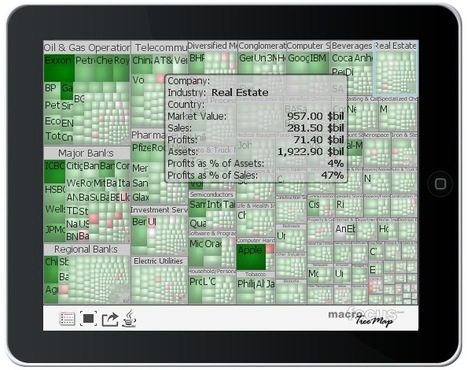
If you are looking for additional visualization tools for displaying data, TreeMap v. 3.0 offers a classic tree map layout as well as others, like squarified variant, circular, tag cloud and voronoi.
Interesting tool, give it a try