


I feel so alive.
Get Started for FREE
Sign up with Facebook Sign up with X
I don't have a Facebook or a X account


 Your new post is loading...
 Your new post is loading...
Your new post is loading...
THE OFFICIAL ANDREASCY's insight:
Big Shoutout and Thanks to our Founder & CEO Andreas Christodoulou for making THE OFFICIAL ANDREASCY possible, for us and for many others. His family prepared him for LIFE and we're beyond and forever grateful for his courage and heroism, in the name of freedom! We love you and we're so proud of you! 
No comment yet.
Sign up to comment

Considering 94% of a website’s first impressions are related to design, we curated a list of the best designed websites for success.
THE OFFICIAL ANDREASCY's insight:
We thought you’d enjoy this new visual that highlights the most important web design tips and trends.
Published on our news site: Read it here (Shorten URL): Pin it for later: Awesome resources for marketers: Leverage your marketing. It's not Revenue - Expenses = Profit, it's Revenue - Expenses = Marketing Euros/Dollars.
From
medium

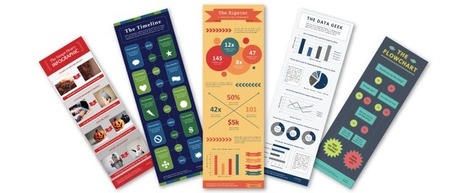
As a marketer, your content strategy is very important. Blogs, articles, social media posts, slide presentations, etc. There are so many ways to market your content. But in the last few years, infographics have caught the attention of online marketers and media professionals. They feature a combination of text, design, and images to convert complex data into an easy-to-read piece of content.With evolving visual communication, infographics are now focusing on driving flexibility, shareability, and audience engagement. The three trends that will help you in doing so are... Via Jeff Domansky

DigitalVibes's curator insight,
October 27, 2017 2:54 PM
Las infografías llaman la atención en el sector del marketing porque combinan texto, diseño e imagen para convertir datos complejos en contenidos de fácil comprensión.
Las tres tendencias actuales en el mundo de la infografía son: 1- Diseño Modular: "crear secciones claras y exclusivas para varios tipos de datos. Esto permite ver las secciones como partes indiviuales de un contenido o como una parte de una infografía". 2- Storytelling: "transportar al usuario de una narrativa a otra, crear una experiencia para ellos y dejarles participar en ella". 3- Contenido Divisible: "crear una pieza central de contenido que puede fragmentarse en muchas". En este enlace se puede seguir leyendo el artículo propuesto y también se explica cada tendencia mediante una infografía: También lanzamos la siguiente pregunta: ¿Cómo pueden ayudar estas tres tendencias en e ámbito periodístico?
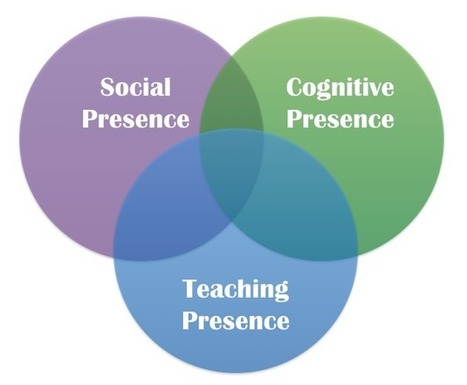
Humanized learning increases the relevance of content and improves students' motivation to log-in week-after-week. When students relate to an online instructor as something more than a subject matter expert and begin to conceive of themselves as part of a larger community, they are more likely to be motivated, be satisfied with their learning, and succeed in achieving the course objectives (Picciano, 2002; Rovai & Barnum, 2003; Richardson & Swan, 2003). Via malek, Stephania Savva, Ph.D, Andreas Christodoulou

Daniel Collins's curator insight,
July 10, 2017 12:15 AM
An infographic with some great ideas the online teacher can try with their courses.

Leading with EQ: Learn how to manage your emotions and be more efficient and effective at work.
THE OFFICIAL ANDREASCY's insight:
Leadership: The role and power of EQ.

Andreas Christodoulou's curator insight,
September 25, 2016 11:13 AM
Are you emotionally intelligent?
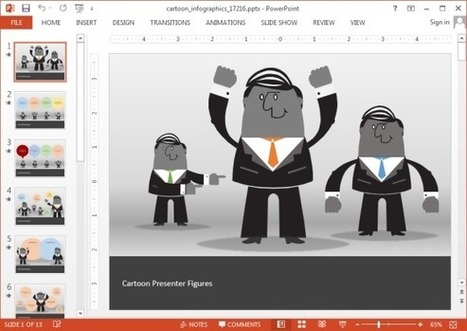
Animated Cartoon Infographics PowerPoint Template depicts cartoon characters in various moods across animated slides and compatible with Microsoft PowerPoint. Via FPPT, michel verstrepen

What is deeper learning and how it can be implemented to support 21st century education? Read on.
THE OFFICIAL ANDREASCY's insight:
Exploring deeper learning and what are the best strategies for implementation based on research findings.

Tony Guzman's curator insight,
February 12, 2016 3:34 PM
This article defines "deeper learning" and research supporting on how to implement it within your classrooms. 
malek's comment,
March 24, 2016 8:47 AM
Thank you for recommendation, a sign of encouragement we all need

JOHN DSOUZA's curator insight,
March 27, 2016 1:35 AM
Exploring deeper learning and what are the best strategies for implementation based on research findings.
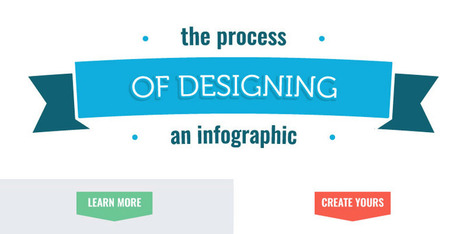
Learn how to create an infographic from an infographic: This interactive breaks down the process of designing an infographic into 5 easy to understand steps Via Baiba Svenca

Raquel Oliveira's curator insight,
June 9, 2015 8:10 PM
Infografico é uma excelente ferramenta visual para desenho instrucional #avancee Simplificar esse processo é o MUST! 
Sue Alexander's curator insight,
June 22, 2015 9:02 AM
This is a wonderful graphic; you get great content presented with clarity and flair. WTG visme. I can run with this.
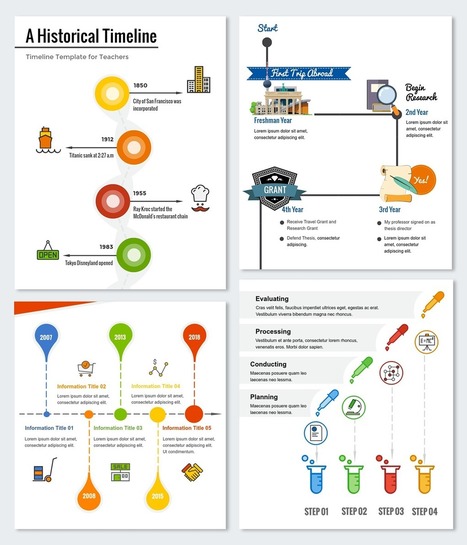
Learn how to easily create professional-looking infographics in PowerPoint with these 10 free templates. Via Baiba Svenca

No Boxes's curator insight,
May 18, 2015 5:25 PM
I love infographics! Thanks to HubSpot for sharing these. 
Sally Spoon's curator insight,
August 6, 2015 12:18 AM
This is a helpful post for those who would like to make infographics in Powerpoint. You can also download 10 free templates.
The main reason why infographics are so successful is that they transpose written data into a visual representation of the ideas that information contains. Visual data is absorbed much more quickly and easily, which leads to faster understanding. The majority of the population learns best through visual stimuli as shown in research undertaken into Individual learning styles, which is why for advertising companies, such as those involved in ecig marketing, relevant information is delivered in a visually interesting, coherent and direct way. Via Jeff Domansky, DKW Online, Stephania Savva, Ph.D

Jeff Domansky's curator insight,
April 11, 2015 2:33 AM
Infographics work because we can process visuals faster. So what are you waiting for? Try your hand at creating your own infographics.

Alison lee's curator insight,
May 20, 2015 11:19 PM
THE PHOTO INFOGRAPH: it is visually appealing and interacts with the reader playfully, however because it has to be more visual and use less text, it misses more specific information and stays instead more general
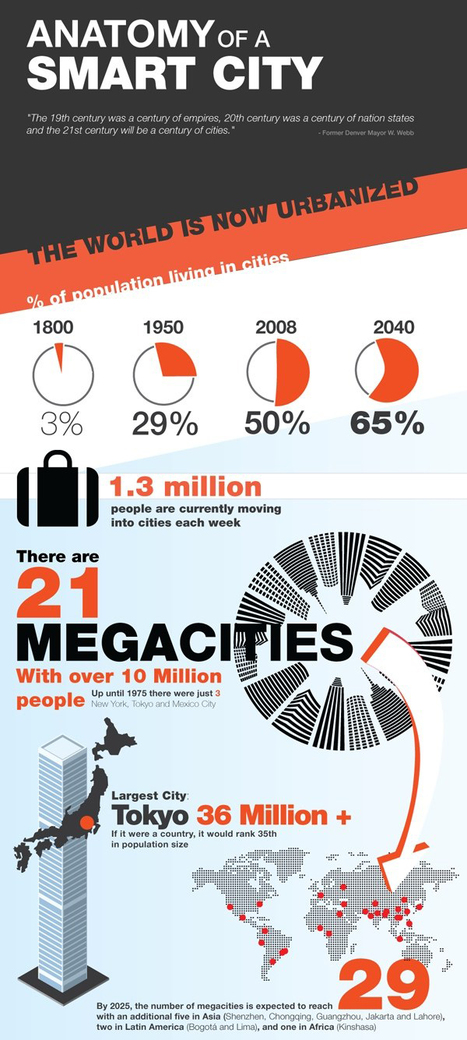
The 19th century was a century of empires, 20th century was a century of nation states and the 21st century will be a century of cities... This outstanding infographic (courtesy of postscapes.com) begins with some information about our current state of urbanization. Did you know that 1.3 million people are moving to cities each week?! It then explains the need for smart cities and delves into what is required to establish these intelligent connected environments, how the smart city may take various forms in the developing worlds and what specific technologies are necessary to achieve such grand goals in practice. Via Lauren Moss, association concert urbain

luiy's curator insight,
December 18, 2014 4:31 AM
We have been grateful to the wide array of planners, architects, techies, entrepreneurs and students of the built environment who have joined us on this journey. And the ‘Smart City‘ has featured again and again, whether it be a futurologist’s insights into the bionic, nature-centric adaptable cities of the future, or an economist’s keen ideas on instilling happiness in the built environment. 
Eli Levine's curator insight,
December 18, 2014 10:45 AM
There is an evolution taking place where politics, policy, technology, the environment, and the economy all intersect. This movement towards technical, empirically driven local policy making could be our saving grace.This could be the future of government.

According to the National Center for Education Statistics, in 2012 approximately 2.6 million students were enrolled in fully-online degree programs, while 5.5 million were taking at least one online course. For institutions to fully understand how to best serve this growing population, it is critical to understand who is studying online and what they are looking for in from their degree program.
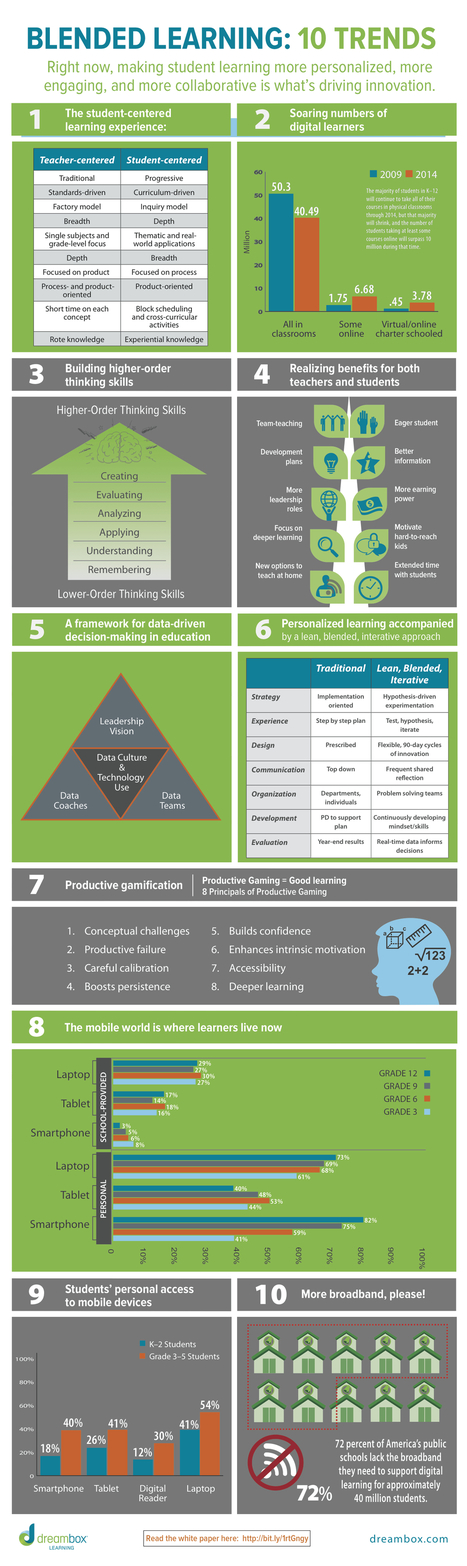
The 10 Blended Learning Trends Infographic gives a snapshot on how making student learning more personalized, more engaging, and more collaborative is what’s driving innovation. Via Tom D'Amico (@TDOttawa)
|

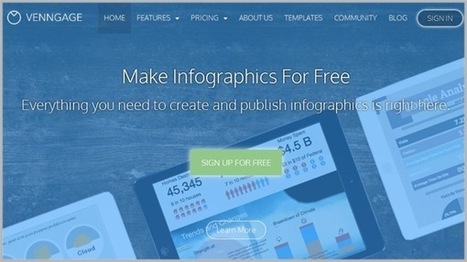
Create powerful smart infographics and visuals without any design skills. Via Tom D'Amico (@TDOttawa) , michel verstrepen

Tyler Leavitt's curator insight,
March 2, 2022 1:02 PM
Graficto is a free tool to create up to 5 infographs/visuals to help make your educational content more engaging!

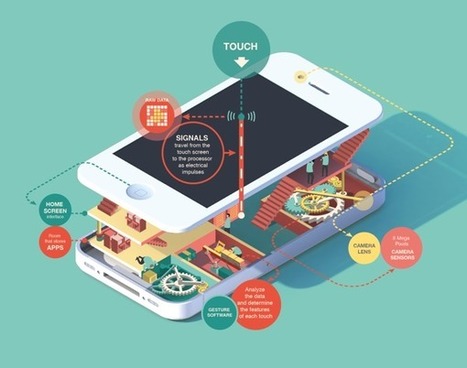
These common mobile app security threats are becoming more prevalent and require more vigilance. Learn the best practices to protect your user's personal data.
THE OFFICIAL ANDREASCY's insight:
An article on the security threats facing mobile apps and tips to protect against them. We cover threats like client-side code injection, insufficient encryption, and reverse engineering, plus tips to defend against them.

Gain an edge in your Online Marketing career and stand out. Learn how to set yourself apart in 2017.
THE OFFICIAL ANDREASCY's insight:
The most important Online Marketing skills you should master in 2017.
Andreas Christodoulou's curator insight,
March 16, 2017 6:52 PM
The must-have Online Marketing skills for 2017.
As a foreign language teacher, I am always looking for innovative ways to allow my students to demonstrate what they have learned.

Simon J Condon's curator insight,
December 2, 2016 2:54 PM
Students can use to show historical developmentioned in subjects
An in-depth article and infographic on how blended learning is changing education.
THE OFFICIAL ANDREASCY's insight:
Technology has changed education and has expanded student opportunities. Get the scoop!
Andreas Christodoulou's curator insight,
August 1, 2016 6:05 AM
Analysis of more than 1,000 learning studies by the department of education show blended learning environments have the greatest impact in improving student achievement. We cover three main types of blended learning models; traditional, hybrid and flipped. We also tackle five common misconceptions about blended learning: http://tiny.cc/BlendedLearningPotential 
Stephania Savva, Ph.D's curator insight,
August 1, 2016 6:09 AM
A really useful article on Blended Learning and the prospect of differentiating teaching and learning strategies.
Find out what's new. For the best experience, please subscribe To our YouTube channel.
Playlists:
- What's New Series: https://rebrand.ly/WhatsNewSeries - Upcoming Articles: https://rebrand.ly/UpcomingArticles - Bonus Reads: https://rebrand.ly/BonusReads - Vintage Series: https://rebrand.ly/VintageSeries - Inspirational Quotes: https://rebrand.ly/InspirationalQuotes - Season's Greetings: https://rebrand.ly/Season-Greetings
THE OFFICIAL ANDREASCY's insight:
Stay on Top of Trends!
Stephania Savva, Ph.D's curator insight,
June 6, 2016 2:04 AM
Love this video! Interesting stuff as always from The *Official AndreasCY*
“ Imagine if you could create an infographic in under 10 minutes without being a designer? Discover 20 tools that will help you when creating infographics.”
Via Jessica Kelly, Mika Auramo, Timo Ilomäki, AnnaB

Jessica Kelly's curator insight,
August 19, 2015 8:57 PM
You already have a list of visual-content tools, right? Yep, me too, and I updated it about six weeks ago. But we're talking tech, right? So no huge surprise to find a few new things here. Check it out. 
António Leça Domingues's curator insight,
August 25, 2015 5:32 AM
Publicação revista sobre ferramentas para criação de infografias.

There's a lot of exciting developments happening in the world of technology - don't fall behind. Sign up so we can keep in touch.
THE OFFICIAL ANDREASCY's insight:
The newsletter will boil it all down for you, providing only the most relevant information and sending it straight to your inbox. We also offer insightful tips, tricks and time-saving techniques with fresh and useful resources.
Click here to sign up for it. See you on the inside! ;)

Jane Shamcey's curator insight,
June 8, 2015 7:12 AM
The best way to keep on top of the latest tech information is to subscribe to our newsletter: http://swyy.co/EAqLdtE
Stephania Savva, Ph.D's curator insight,
June 8, 2015 7:14 AM
Seek no further for reliable and up to date tech news from around the globe delivered right to your inbox. Also check their latest tweets: https://twitter.com/andreaschriscy

Are you planning and communicating your feedback criteria? Here is our Blended and Online Assessment Taxonomy Design, an infographic to help you plan better assessments.

Barbara Macfarlan's curator insight,
April 23, 2015 5:17 PM
This is a very useful reminder for when we lose inspiration and wonder what it' serially all about. 
Sandra Ciccarello's curator insight,
April 23, 2015 9:06 PM
This is perfect! Brings task creation, assessment of learning, feedback and differentiation all together in one easy to understand visual. I like it a lot. 
Georgia Heffernan's curator insight,
April 26, 2015 7:43 PM
To enable our students to become assessment literate, teachers need to align their assessment feedback practices with the purpose of the learning. This info graphic provides an easy to use guide based on Bloom's taxonomy of developmental learning - a good reminder to be deliberate!

Well, I’m here to tell you that it’s definitely possible to create some awesome infographics in any category that you choose, EVEN if you’re not a designer. In this blog post, I’m going to introduce you to three awesome tools to create the best infographics, tell you how to use them AND how you can share your infographics in different channels all over the web. So, let’s get started!.. Learn more: - http://www.scoop.it/t/21st-century-learning-and-teaching/?tag=Infographics Via Jeff Domansky, Gust MEES

Well Connected Mom's curator insight,
April 10, 2015 4:11 PM
Infographics makes statistics visually interesting and more palatable. 
Daniel de Lisle's curator insight,
April 23, 2015 5:05 PM
New to infographics and want to get a handle on how to make complex data speak to your clients then read on.
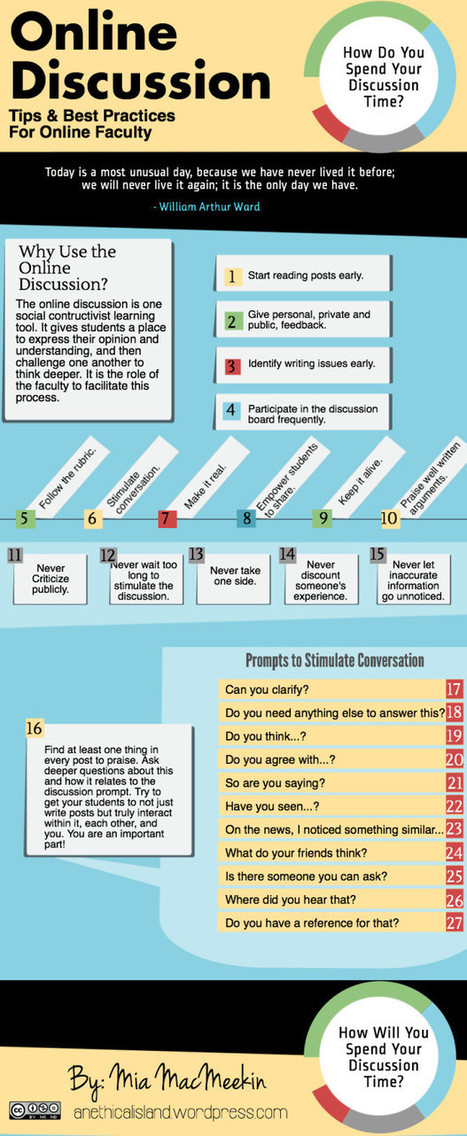
Facilitating discussions between students is one of those things that is infinitely easier when you’re teaching in a physical classroom rather than online. When the students are all in one room, discussions happen more naturally. Facilitating the same type of productive, useful discussion when teaching online is more of a challenge. Via Mª Jesús García S.M.

Irmgard Huppe's curator insight,
November 28, 2014 5:13 AM
short and sharp collection of a few important pointers 
Almudena Rueda's curator insight,
February 7, 2015 1:17 PM
Another great Infographics from Edudemic.
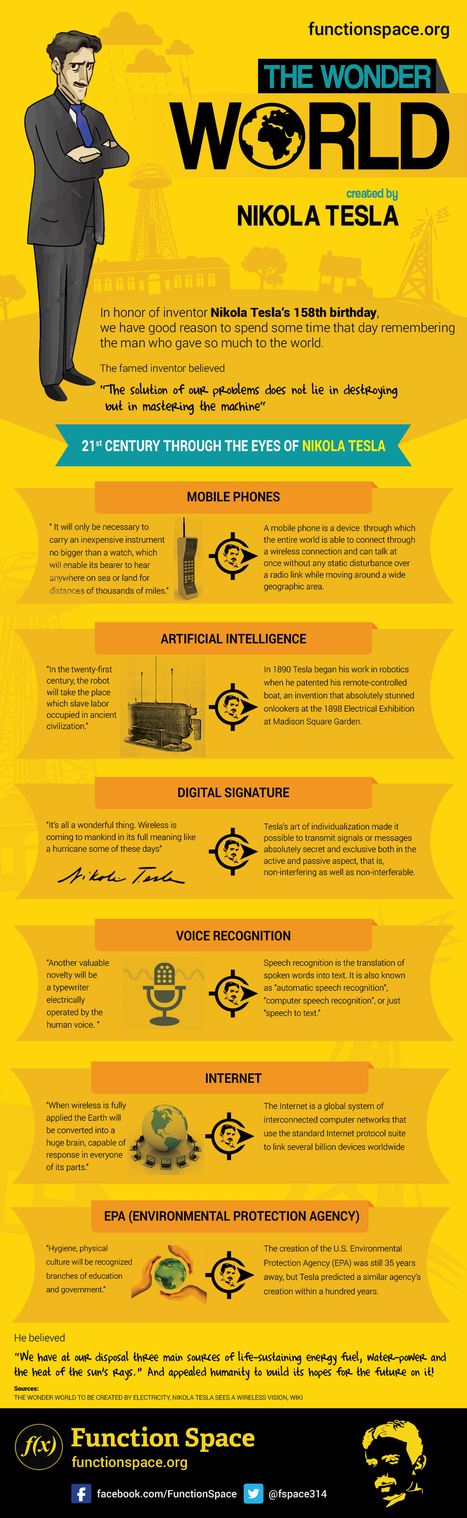
Happy Birthday Nikola Tesla Via Daniel Tan
THE OFFICIAL ANDREASCY's insight:
Nice one! Check our infographics section for more.

Daniel Tan's curator insight,
July 11, 2014 1:40 AM
Tesla - a big man with lesser known fame. Today, we are beginning to recognize his contributions to humankind.
Who says brilliance does not pay? |


