

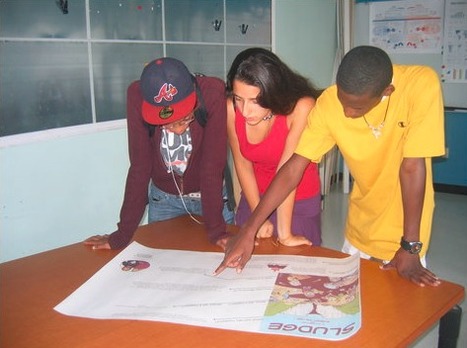

In our final post of Infographics Week, a history teacher tells how she used the Gulf oil spill to have students create infographics about the worst disasters in American history.
Via Beth Dichter, robinwb
Get Started for FREE
Sign up with Facebook Sign up with X
I don't have a Facebook or a X account


 Your new post is loading...
 Your new post is loading...
Your new post is loading...
In our final post of Infographics Week, a history teacher tells how she used the Gulf oil spill to have students create infographics about the worst disasters in American history. Via Beth Dichter, robinwb 
|


Infographics is a new kind of visual literacy. They are a kind of visual summary of information that would take a reader hours to process
This was a great project for our teachers last year. We are posting their info graphics outside out Office of Professional Development.
Been loving infographics and looking for a good way to incorporate these. Hoping for an app that would make them easily. We'll see what this has to say...