Learn how to deploy simulations and models to the isee Exchange using authentication and data collection.
Research and publish the best content.
Get Started for FREE
Sign up with Facebook Sign up with X
I don't have a Facebook or a X account
Already have an account: Login

Thinking about Systems
9.9K views |
+0 today
For those who are passionate about systems thinking.
Curated by
Steve Wilhite
 Your new post is loading...
 Your new post is loading...
Your new post is loading...

We’re super excited to share that you can now build network visualizations on top of geographic maps in Kumu. This has been one of our most requested features, with many of you looking to build… 
As a cofounder of Kumu, I get to see A LOT of system maps. And thanks to the great work of Gene Bellinger, Rob Ricigliano, David Peter Stroh, and countless others — systems mapping appears to be on…
Join us for this free webinar highlighting Model Mysteries, An Exploration of Vampires, Zombies and Other Fantastic Scenarios to Make the World a Better Place. Just released, this resource is a fun, engaging entry point to modeling. Based on a philosophy that “copying” models is a stepping stone to understanding, each chapter provides a guided path to build and then modify a model, applying one generic structure to a variety of contexts. The webinar will demonstrate how these small models can easily be built using Stella® online, shared with others, and used to foster new insights about how systems work.

Last week we brought you news of a world map purportedly more accurate than any to date, designed by Japanese architect and artist Hajime Narukawa. The map, called the AuthaGraph, updates a centuries-old method of turning the globe into a flat surface by first converting it to a cylinder.

Stella Online is a powerful web application used for modeling and diagramming on any web-browser

Use the iMODELER to gain insights, explore how things are interconnected and enhance your brain’s capability to tackle complexity. It will make you become more successful. The new iMODELER offers a revolutionary way to both visualize and analyze (via its unique Insight Matrix) complexity, thus allowing for better planning, decision-making and communication. The iMODELER even allows for quantitative (e.g. system dynamics) modeling of scenarios.

isee systems is dedicated to increasing understanding of our world through modeling and simulation software. Our software includes Stella Architect, Stella Professional and Stella Designer. Stella Simulator is a stand-alone, XMILE-compatible simulation engine based on isee systems’ well-known STEAM engine that can be used for server or High Performance Computing (HPC) applications, or embedded in desktop applications. Available for Windows, Macintosh, and Linux, it allows full control over parameters at each step of the model run.
We are teaming up with the System Dynamics Society to run a hackathon at the International System Dynamics Conference on July 17-21 in Delft, Netherlands. System Dynamics is probably the best modeling discipline to illustrate how climate effects large ecosystems over time. An SD model looks like a flow chart, with stocks of goods that grow or shrink based on inflows and outflows. It is particularly good for illustrating the tertiary consequences of policy and events on large ecosystems.
From
youtu

Stella Architect is the definitive modeling tool to create professional simulations and presentations. Seamlessly design, build and publish models to shar
From
www
This post is a part of our systems thinking tools blog series where we’re introducing and sharing guidance for using different tools to support systems thinking and practice.
|

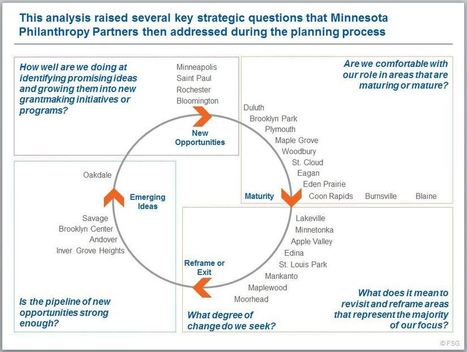
In How systems mapping can help you build a better theory of change, we discussed the importance of differentiating between the theory of change approach and theory of change diagram. The former is a…
Via Complexity Digest, june holley
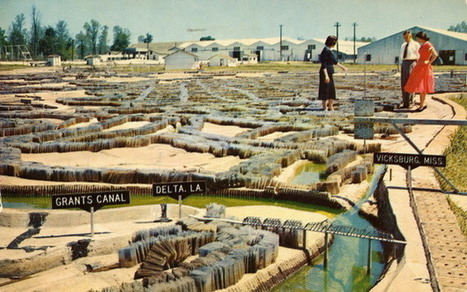
Discover The Mississippi River Basin Model in Jackson, Mississippi: Built by prisoners of war, the largest small-scale model ever built includes eight miles of tiny streams that now sit abandoned.
Steve Wilhite's insight:
Old school modeling and simulation ...

3D visual thinking for creative brainstorming, problem solving, collaborative research and education.

From
metasd
I’ve always looked over the fence into the big data pasture with a bit of envy, because it seemed that most projects were more tactical, and establishing value based on immediate operational improvements would be fairly simple. So, I was surprised to see data scientists’ angst over establishing business value for their work.

System dynamics re-imagined We’re combining storytelling, math, and purposeful design to make models that are as intuitive as they are insightful.
Steve Wilhite's insight:
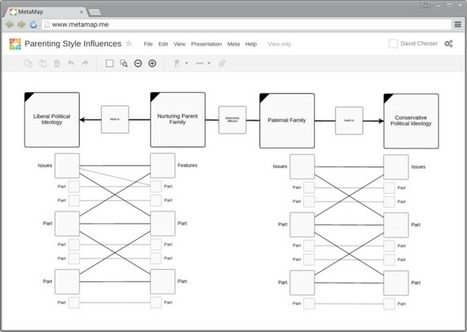
MetaMap helps you apply Systems Thinking to solve wicked problems. Work together to visualize concepts, relationships, and perspectives in order to communicate a deeper understanding of complex systems.

Deciding when to expand a business is difficult in any industry. For the airline industry, there are both large investments and long delays involved in expansion, making it important to test your assumptions as you go. This model uses a Bass Diffusion model to start and then expand an airline business. Expansion occurs when the predicted market share exceeds a specific threshold, which provides some headroom for additional growth in existing markets as expansion takes place. This simple model does not look at the impact of competitors, but rather sets the number of potential passengers to those the airline can expect to win over time. There is a limit on the number of routes that can be added before saturating the market.
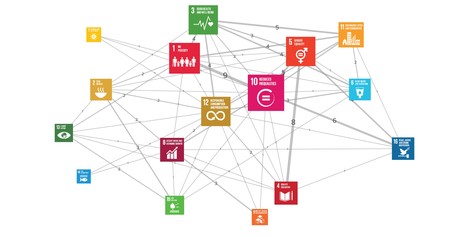
A number of the users in our community are working on maps related to the UN Sustainable Development Goals (or "SDGs"). Rather than each of you re-creating the wheel to get the icons and colors used to represent each SDG, we decided to put together an SDG toolkit to jumpstart
From
medium
Tools and Practices: Folding Circles

Welcome to Perspectives where we endeavor to create and surface noteworthy relationships and their implications as unfolding stories, to provoke thought, foster discussion, deeper understanding, insights, and more effective action.
|