Visual Literacy
9.9K views | +0 today
Follow
Visual Literacy
Images, lesson plans, ideas, infographics and other resources to use when developing visual literacy in kids.
Curated by BookChook
Your new post is loading...
Rescooped by BookChook from Digital Presentations in Education
Scoop.it!

46 Tools To Make Infographics In The Classroom

46 Tools To Make Infographics In The Classroom | Visual Literacy | Scoop.it

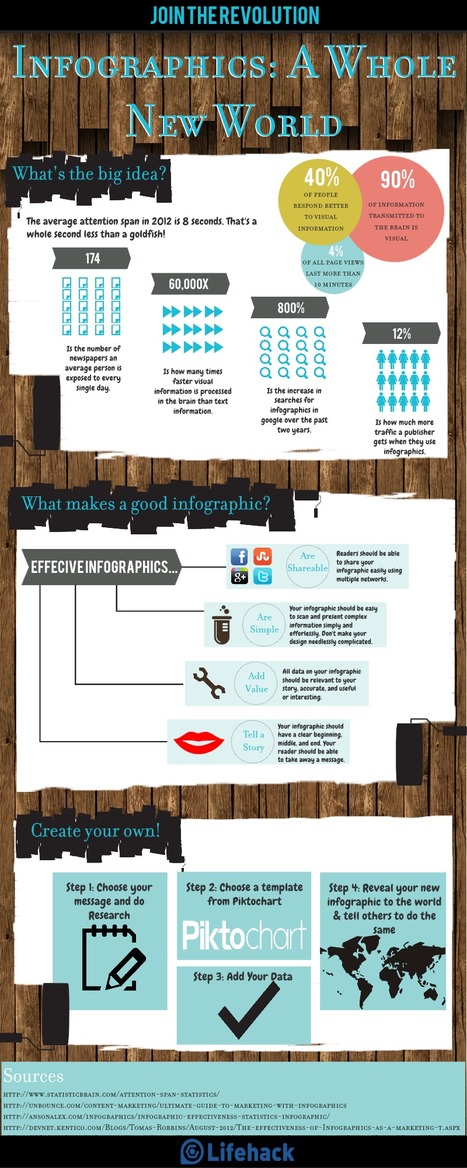
Infographics are interesting–a mash of (hopefully) easily-consumed visuals (so, symbols, shapes, and images) and added relevant character-based data (so, numbers, words, and brief sentences).

The learning application for them is clear, with many academic standards–including the Common Core standards–requiring teachers to use a variety of media forms, charts, and other data for both information reading as well as general fluency...


Via Baiba Svenca
BookChook's insight:

An almost overwhelming but potentially useful list.

maite collados's curator insight, January 14, 2014 11:24 AM

Las infografías son una herramienta muy útil por su factor visual: en poco espacio y de forma visulamente agradable y atrayente, engloba datos y relaciona conceptos.

ManufacturingStories's curator insight, July 30, 2014 7:50 AM

For more resources on Social Media & Content Curation visit http://bit.ly/1640Tbl


Cynthia Day's curator insight, July 30, 2014 2:45 PM

apps

Rescooped by BookChook from visual data
Scoop.it!

All You Need to Know About Infographics: Tips, Tutorials, Guides

All You Need to Know About Infographics: Tips, Tutorials, Guides | Visual Literacy | Scoop.it

Let’s be honest, we don’t like to read big pieces of text. Text-heavy graphs are rather difficult for understanding, especially when dealing with numbers and statistics. That is why illustrations and flowcharts are often used for such kind of information.

An infographic, or a visual representation of study or data, like anything else, can be done right or wrong. How to create a successful infographic? A good idea and a good design.


Stop by the link for more on what defines an infographic, what contributes to its popularity, as well as the various types of infographics and references for tutorials and best practices.


Additional topics covered include:

The major parts of an infographic How to create an infographic Developing ideas & organizing data Research & sources Typography, graphics & color Facts & conclusions Designing & Editing
Via Lauren Moss
HCL's curator insight, April 30, 2014 9:26 PM

Some good tips here...

Rescooped by BookChook from 21st Century Tools for Teaching-People and Learners
Scoop.it!

Simple Guide to Creating Infographics in PowerPoint [Template]

Simple Guide to Creating Infographics in PowerPoint [Template] | Visual Literacy | Scoop.it
Learn how to create an infographic without a designer using PowerPoint.


Read more:

http://blog.hubspot.com/blog/tabid/6307/bid/33499/The-Marketer-s-Simple-Guide-to-Creating-Infographics-in-PowerPoint-Template.aspx


Via Yolanda de Lucas, IES Consaburum, Gust MEES
No comment yet.
Rescooped by BookChook from Integrating Technology in the Classroom
Scoop.it!

How to Create Stunning Infographics in 30 Minutes or Less

How to Create Stunning Infographics in 30 Minutes or Less | Visual Literacy | Scoop.it

Learn how to create stunning infographics - without spending hundreds of dollars on a graphic designer or losing your mind - in just 30 minutes or less.

From word clouds to network data visualizations, infographics have become a primary format for content in a relatively short period of time. Although the ‘infographic’ is nothing new, its proliferation and evolution has been nothing short of exponential in the past few years.

Whether you love them or hate them, the rising popularity of infographics can’t be denied.


Via Baiba Svenca, Abi Woldhuis
Jeff Domansky's curator insight, January 7, 2013 4:29 PM

Really excellent how-to using the impressive Piktochart infographic tool.

Neil Ferree's curator insight, February 26, 2013 10:05 AM

Infographics done right and done well can generate lots of traffic to your http://bit.ly/RichSnippet and build your brand

Charles-Louis Mazerolles's curator insight, March 8, 2013 3:28 AM

good tool to know :-)

Rescooped by BookChook from Informatics Technology in Education
Scoop.it!

The Ultimate Guide To Infographics | Edudemic

The Ultimate Guide To Infographics | Edudemic | Visual Literacy | Scoop.it

Via juandoming, Informatics
No comment yet.