Visualization Techniques and Practice
16.3K views | +0 today
Follow
Visualization Techniques and Practice
How to use visualization techniques for nonprofits in areas like data analysis, learning, facilitation, and innovation
Curated by Beth Kanter
Your new post is loading...
Rescooped by Beth Kanter from visual data
Scoop.it!

Artists use data to make political statements

Artists use data to make political statements | Visualization Techniques and Practice | Scoop.it

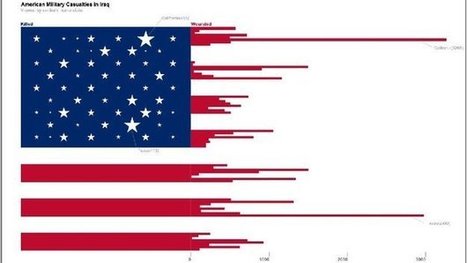
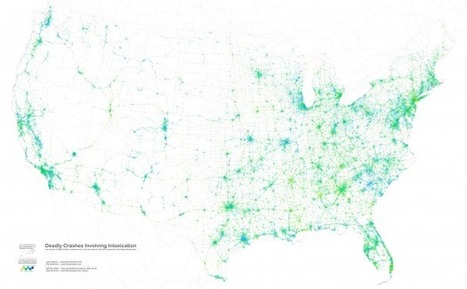
Big data can feel impersonal, overwhelming and cold. But stark statistics are now being used to make intimate statements through art and public advocacy.


The past few years have seen the widespread availability of a large amount of data, thanks largely to the internet.

Census reports are easily searchable, campaign polling is expertly parsed and analysed, and online dating behaviour provides a glimpse into human sexuality.


Now more artists are using these impersonal details to make an impassioned statement; visit the article link for examples.


Via Lauren Moss
Astrakhan's comment, February 9, 2013 3:44 AM
DataScientists = Data Artists
Rescooped by Beth Kanter from visual data
Scoop.it!

Is Data Visualization Art?

Is Data Visualization Art? | Visualization Techniques and Practice | Scoop.it

Data Visualization is driven by data. Its form is often derived from optimizing the efficiency of inputting data (and information about that data) into a human brain. It is a very pragmatic practice, built around numbers and logic.


And yet it is beautiful. It evokes emotions. It can be aesthetically pleasing, or hideous. It communicates complex concepts and provokes thought. It is consumed for enjoyment. Some visualizations even share similarities with poetry.

There are several stages in the life cycle of data visualizations, and while the core of the practice is driven by rational thinking, any number of stages in the process have opportunities for subjective decisions or artistic interpretations...


Via Lauren Moss
Lauren Moss's curator insight, January 24, 2013 7:42 PM

An overview of the creative and artistic processes involved in data visualization...