


Research and publish the best content.
Get Started for FREE
Sign up with Facebook Sign up with X
I don't have a Facebook or a X account
Already have an account: Login

Visualization Techniques and Practice
16.3K views |
+0 today
How to use visualization techniques for nonprofits in areas like data analysis, learning, facilitation, and innovation
Curated by
Beth Kanter
 Your new post is loading...
 Your new post is loading...
Your new post is loading...
Curated by Beth Kanter This tumblr blog is a daily post of a chart from the authors of "I Love Charts" - not much commentary - the chart speaks for itself 
|
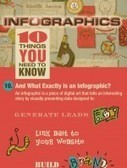
Graphs are a visual treat, as they can present complex information in a quick and easy manner. Mostly graphs are used to reveal a trend, compare statistics or

Beth Kanter's curator insight,
December 30, 2012 4:07 PM
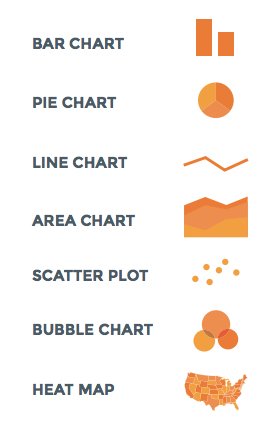
Handy cheat sheet for picking the right chart and graph. Text description and infographic. 
Stephen Dale's curator insight,
December 31, 2012 4:21 AM
A useful overview of different types of graphs and where they might be used. |


Really useful guide to selecting and designing charts and graphs to visualize your data.