Visualization Techniques and Practice
16.3K views | +0 today
Follow
Visualization Techniques and Practice
How to use visualization techniques for nonprofits in areas like data analysis, learning, facilitation, and innovation
Curated by Beth Kanter
Your new post is loading...
Rescooped by Beth Kanter from visual data
Scoop.it!

Infographic Design Vector Elements: Resources for creating visualizations

Infographic Design Vector Elements: Resources for creating visualizations | Visualization Techniques and Practice | Scoop.it

A collection of resoureces and links to free infographic design vector elements, including various graphics, charts, labels, pictograms, symbols, maps and more- for use in designing infographics and data visualizations.

Simply open the files in a vector based program and edit...


Via Lauren Moss
Dazhi Jiang's curator insight, December 12, 2012 5:35 AM

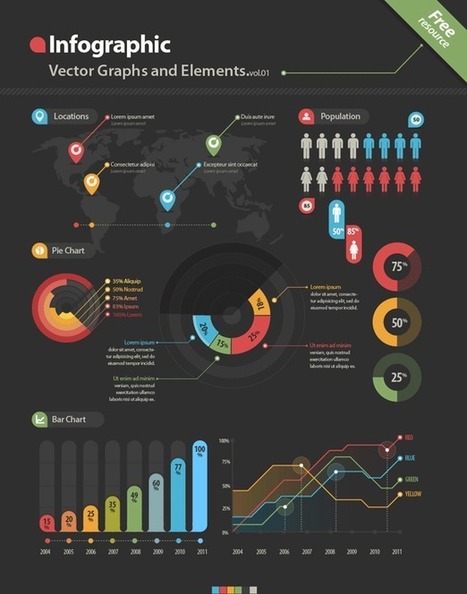
Infographic resources

Rescooped by Beth Kanter from visual data
Scoop.it!

5 Free Tools for Creating Infographics

5 Free Tools for Creating Infographics | Visualization Techniques and Practice | Scoop.it

Generally, people don’t have the time or energy to sit and plow through pages or screens of text; they want to be able to ingest information as quickly and easily as possible. With the recent rise of infographics (information graphics), what used to require an avalanche of stats or analyses to dissect, can now be interpreted and relayed into an easy-to-read, fun, and visually appealing schematic – and an excellent content marketing concept. Infographics, when designed well, can be applied to different online sites and social networks.

Summarized at the article are 5 free tools (with links) that allow you to start creating simple infographics or explore the potential of data visualization...


Via Lauren Moss
Cb Bowman's curator insight, September 10, 2013 12:33 PM

The Tools Needed To Get You Started in Using Infographics