Visualization Techniques and Practice
16.3K views | +0 today
Follow
Visualization Techniques and Practice
How to use visualization techniques for nonprofits in areas like data analysis, learning, facilitation, and innovation
Curated by Beth Kanter
Your new post is loading...
Rescooped by Beth Kanter from visual data
Scoop.it!

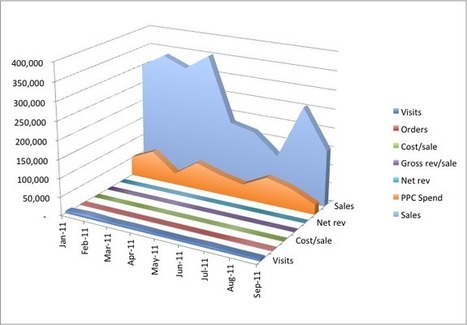
6 Deadly Sins of Data Visualization

6 Deadly Sins of Data Visualization | Visualization Techniques and Practice | Scoop.it
You’re a marketer. And half your job is marketing your ideas. Like it or not, you have to be good at proving your point, ‘cause being right isn’t enough. You have to justify the time, dollars and effort required for your internet marketing campaign. In the meeting room struggle for resources, your best weapon is great data presentation.

Events tell a story. and people more easily follow a story told visually than one told verbally.

Want to get better? Avoid these six gigantic visualization mistakes...


Via Lauren Moss
No comment yet.
Rescooped by Beth Kanter from visual data
Scoop.it!

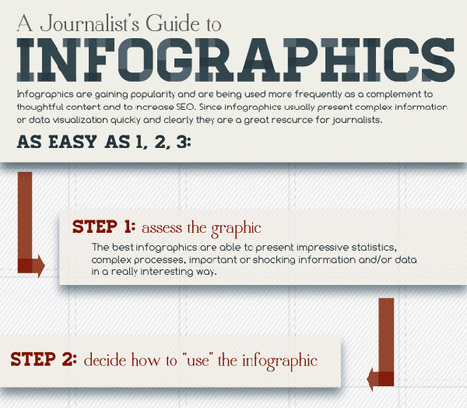
How To Assess Quality of Infographic

How To Assess Quality of Infographic | Visualization Techniques and Practice | Scoop.it

Curatored by Beth Kanter

http://www.bethkanter.org


Is an infographic good or not?

(1)  Graphics - look/feel

(2)  Are there insights shared based on data?


Via Lauren Moss
No comment yet.
Rescooped by Beth Kanter from visual data
Scoop.it!

So you wanna design your own infographic?

So you wanna design your own infographic? | Visualization Techniques and Practice | Scoop.it

Curated by Beth Kanter

http://www.bethkanter.org


There are a lot of tools that can help you create an infographic, but if you want to work for your nonprofit you need some design skills.    But a good infographic is not just about being a pretty picture, it requires research and making sure that it is conveying the right message.   Designing infographics is a hybrid design skill - falling somewhere inbetween print, web, and data visualization skills.


This post summarizes the design process:


1. Define concept and goals

2. Use reliable resources

3. Data should have a flow or tell a story


The article is written for designers so the 4th principle is get client feedback.   For nonprofits, it  means getting some feedback from people who are your intended audience - almost like beta testing a web site.


Has your nonprofit hired a designer to create an infographic or create a DYI version?   What are your tips and best practices.


Via Lauren Moss
No comment yet.
Rescooped by Beth Kanter from Chambers, Chamber Members, and Social Media
Scoop.it!

Why Images Actually Matter [Infographic]

Why Images Actually Matter [Infographic] | Visualization Techniques and Practice | Scoop.it
Images make everything better!
Well, not everything, just most things.
Currently, we are watching the rise of visual social media. Images are getting more traction than words on Instagram, Pinterest, YouTube and Facebook.

Via Frank J. Kenny
Beth Kanter's comment, September 2, 2012 12:04 PM
Terrific find!
Scooped by Beth Kanter
Scoop.it!

Tips, tricks and resources to make your own gorgeous infographics

Tips, tricks and resources to make your own gorgeous infographics | Visualization Techniques and Practice | Scoop.it
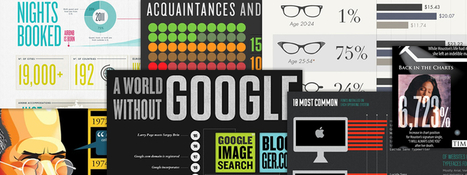
Infographics (or Information Graphics) are graphic visual representations of data or information, presented in a way to make it easier to consume information. Infographics gained popularity ...
No comment yet.
Scooped by Beth Kanter
Scoop.it!

Data Visualization: Simplicity

Data Visualization:  Simplicity | Visualization Techniques and Practice | Scoop.it

Curated by Beth Kanter

http://www.bethkanter.org  


A big hat tip to Lauren Moss, another visual data curator - http://www.scoop.it/t/visual-data for finding this post from Flowing Data blog on data visualization techniques for non graphic designers.


This points out the important of simplicity.  How can you illustrate your insight as simply and sharply as possible? 


No comment yet.