Visualization Techniques and Practice
16.3K views | +0 today
Follow
Visualization Techniques and Practice
How to use visualization techniques for nonprofits in areas like data analysis, learning, facilitation, and innovation
Curated by Beth Kanter
Your new post is loading...
Rescooped by Beth Kanter from visual data
Scoop.it!

Which infographic is right for you?

Which infographic is right for you? | Visualization Techniques and Practice | Scoop.it

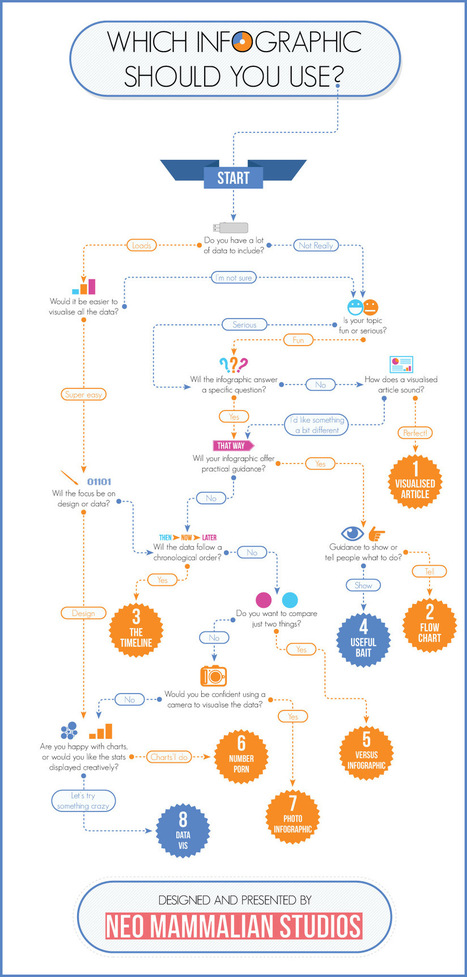
That’s right, there’s more to infographics than a scrolling image full of facts and figures. Different types of infographics are consumed differently.

The right kind of infographic should match your data to your narrative and ensure that people take away your message after reading it.

While infographics may not come in that many shapes or sizes (600 x 1,800 pixels is the norm), that doesn’t mean there’s a stock standard infographic for you.  

Use the flowchart to help you decide which infographic is right for you...


Via Lauren Moss
No comment yet.
Rescooped by Beth Kanter from visual data
Scoop.it!

11 of the Most Influential Infographics of the 19th-Century...

11 of the Most Influential Infographics of the 19th-Century... | Visualization Techniques and Practice | Scoop.it
We live in a world steeped in graphic information. From Google Maps and GIS to the proliferation of infographics and animated maps, visual data surrounds us.

While we may think of infographics as a relatively recent development to make sense of the immense amount of data available on the Web, they actually are rooted in the 19th century.

Two major developments led to a breakthrough in infographics: advances in lithography and chromolithography, which made it possible to experiment with different types of visual representations, and the availability of vast amounts of data, including from the American Census as well as natural scientists, who faced heaps of information about the natural world, such as daily readings of wind, rainfall, and temperature spanning decades.

But such data was really only useful to the extent that it could be rendered in visual form. And this is why innovation in cartography and graphic visualization mattered so greatly...


Via Lauren Moss
No comment yet.
Rescooped by Beth Kanter from visual data
Scoop.it!

Artists use data to make political statements

Artists use data to make political statements | Visualization Techniques and Practice | Scoop.it

Big data can feel impersonal, overwhelming and cold. But stark statistics are now being used to make intimate statements through art and public advocacy.


The past few years have seen the widespread availability of a large amount of data, thanks largely to the internet.

Census reports are easily searchable, campaign polling is expertly parsed and analysed, and online dating behaviour provides a glimpse into human sexuality.


Now more artists are using these impersonal details to make an impassioned statement; visit the article link for examples.


Via Lauren Moss
Astrakhan's comment, February 9, 2013 3:44 AM
DataScientists = Data Artists
Rescooped by Beth Kanter from visual data
Scoop.it!

Why Infographics Are Visual Thinking

Why Infographics Are Visual Thinking | Visualization Techniques and Practice | Scoop.it

Beth Kanter

http://www.bethkanter.org


Another way to articulate the importance of sense-making.


Think about it this way: Tools are not always actual objects designed to help us with physical activities. A notebook, whether it is a Moleskine or an Evernote digital document, is a tool that expands our memory. A digital calculator, whether it is an inexpensive machine bought in the nearest Dollar Tree or an app downloaded to your iPhone, frees you from the burden of having to retain and execute many complex mathematical algorithms. Non-physical tools (or sets of tools and practices), such as statistics and the scientific method, evolved to let us gaze beyond what we would normally see, and to overcome our deepest biases and lazy habits of mind. The same is true for great visual displays of information...


Via Lauren Moss
No comment yet.