Visualization Techniques and Practice
16.3K views | +0 today
Follow
Visualization Techniques and Practice
How to use visualization techniques for nonprofits in areas like data analysis, learning, facilitation, and innovation
Curated by Beth Kanter
Your new post is loading...
Rescooped by Beth Kanter from visual data
Scoop.it!

How Facebook's New Machine Brain Will Learn All About You From Your Photos

How Facebook's New Machine Brain Will Learn All About You From Your Photos | Visualization Techniques and Practice | Scoop.it
Facebook poaches an NYU machine learning star to start a new AI lab that may very well end up knowing more about your social life than you do.

Facebook users upload 350 million photos onto the social network every day, far beyond the ability of human beings to comprehensively look at, much less analyze. And so that’s one big reason the company just hired NYU machine learning expert Yann LeCun as director of Facebook’s new AI laboratory, an eminent practitioner of an artificial intelligence (AI) technique known as “deep learning.”

“Yann LeCun's move will be an exciting step both for machine learning and for Facebook, which has a lot of unique social data,” says Andrew Ng, who directs the Stanford Artifical Intelligence Laboratory and who led a deep-learning project to analyze YouTube video for Google. “Machine learning is already used in hundreds of places throughout Facebook, ranging from photo tagging to ranking articles to your newsfeed. Better machine learning will be able to help improve all of these features, as well as help Facebook create new applications that none of us have dreamed of yet.”


Via Lauren Moss
Lewis Walker's curator insight, December 21, 2013 9:38 AM

Mega data collection is not just the government, it is the wave of the future. The question is how will we use it?

Rescooped by Beth Kanter from visual data
Scoop.it!

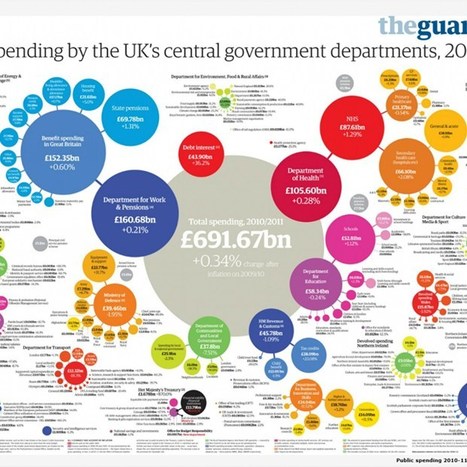
2012 Winners of the Information is Beautiful awards

2012 Winners of the Information is Beautiful awards | Visualization Techniques and Practice | Scoop.it

On September 27th, the world's best examples of visually stunning information was recognized at the inaugural Information is Beautiful awards.

The event, held at London's Institute of Contemporary Arts, awarded designers from all over the world in a variety of categories, including data visualisation, infographics and data journalism.

When David McCandless, author, data journalist and founder of the IIB data-visualisation studio, announced in early 2012 that IIB was looking for award applicants, he was inundated with over 1,000 entries.

"I've just been amazed by the sheer quality of the creative work submitted to the awards from around the world," McCandless told Wired.co.uk. "There are a number of criteria we look for when judging these awards. Not only do they have to have the right visual quality and be easily understood, they have to have that invisible element of story telling as well."


Read the complete article for a closer look at all the winners, selected by a panel of judges including musician and visual artist Brian Eno, senior curator of the Museum of Modern Art Paola Antonelli, BrainPickings.org editor Maria Popova and Guardian Datablog editor Simon Rogers.


Via Lauren Moss
No comment yet.
Rescooped by Beth Kanter from visual data
Scoop.it!

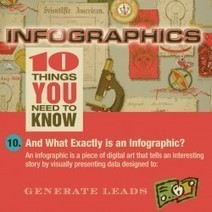
INFOGRAPHICS: 10 THINGS YOU NEED TO KNOW | Visual.ly

INFOGRAPHICS: 10 THINGS YOU NEED TO KNOW | Visual.ly | Visualization Techniques and Practice | Scoop.it

Kevin Akers design + imagery has just designed an infographic about infographics.
The list of top ten things everyone should know about the new marketing phenomenon clarifies how to create interesting,noteworthy infographics...


Via Lauren Moss
No comment yet.