


 Your new post is loading...

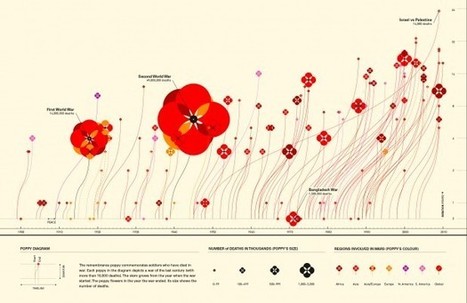

Often, complex stories are more easily communicated, understood and, ultimately, remembered, when they take visual form.
Aside from data and words, infographics use images and graphical representations. Those key elements – images, words and numbers – operate as a system for simplifying information, revealing new patterns, and producing new knowledge in various fields. In fact, they might not have always been called “infographics,” but info/data-based visualizations have always been around.
Via Lauren Moss


![The Impact of the Electric Car [Infographic] | #eHealthPromotion, #SaluteSocial | Scoop.it](https://img.scoop.it/YBsp7-c6yM1FTqZWeWGLlzl72eJkfbmt4t8yenImKBVvK0kTmF0xjctABnaLJIm9)
![10 Amazing Social Media Statistics [INFOGRAPHIC] | #eHealthPromotion, #SaluteSocial | Scoop.it](https://img.scoop.it/w7o92dIBdem4QnASs1Hy2Dl72eJkfbmt4t8yenImKBVvK0kTmF0xjctABnaLJIm9)


Interesting!