Your new post is loading...
Tumorrestzellen: Standardisierte Flüssigbiopsien sollen Krebstherapie verbessern
According to the new market research report "Flow Cytometry Market Size, Growth by Technology (Cell-based, Bead-based), Product & Service (Analyzer, Sorter, Consumables, Software), Application ((Research - Immunology, Stem cell), (Clinical - Hematology)), End user (Biotech, Hospitals) - Global Forec...
A conversation with Gert Van Isterdael, Head of VIB Flow Core at the VIB-UGent Center for Inflammation Research
Background and Objective. Reference ranges are necessary in clinical chemistry and hematology to compare an observed value and to provide meaningfu...
Researchers from the University of Technology Sydney have developed a new device that can detect and analyze cancer cells from blood samples, enabling doctors to avoid invasive biopsy surgeries, and to monitor treatment progress.
In this webinar, Mirko Corselli discusses the similarities, differences, and advantages of spectral flow cytometry compared to conventional flow.
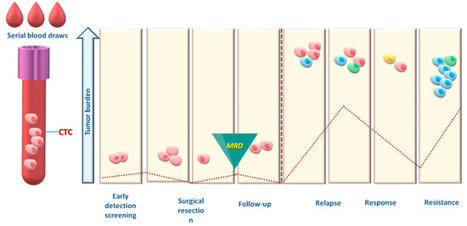
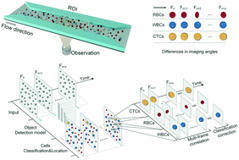
The potential clinical utility of circulating tumor cells (CTCs) in the diagnosis and management of cancer has drawn a lot of attention in the past 10 years. CTCs disseminate from tumors into the bloodstream and are believed to carry vital information about tumor onset, progression, and metastasis. In addition, CTCs reflect different biological aspects of the primary tumor they originate from, mainly in their genetic and protein expression. Moreover, emerging evidence indicates that CTC liquid biopsies can be extended beyond prognostication to pharmacodynamic and predictive biomarkers in cancer patient management. A key challenge in harnessing the clinical potential and utility of CTCs is enumerating and isolating these rare heterogeneous cells from a blood sample while allowing downstream CTC analysis. That being said, there have been serious doubts regarding the potential value of CTCs as clinical biomarkers for cancer due to the low number of promising outcomes in the published results. This review aims to present an overview of the current preclinical CTC detection technologies and the advantages and limitations of each sensing platform, while surveying and analyzing the published evidence of the clinical utility of CTCs.
The combined detection of three antibody isotypes (IgG, IgM and IgA) in a single well of a 96- or 384-well plate not only saves time and precious patient samples, but also provides a dynamic, comprehensive profile of the humoral response over time following natural infection with SARS CoV-2 or...
bioRxiv - the preprint server for biology, operated by Cold Spring Harbor Laboratory, a research and educational institution...
📚 Atlas of Liquid Biopsy Circulating Tumor Cells and Other Rare Cells in Cancer Patients’ Blood. Chapter 1, page 2. Ludmilla Thomé Domingos…
Julie Lovchik will discuss how advanced flow cytometry instrumentation facilitates multiplex assessment of IgG, IgM, and IgA antibodies against SARS-CoV-2.
|
Probiotic enumeration is a key testing component to ensure reliable and compliant products reach consumers. Eurofins offers a unique ISO 17025 accredited flow cytometry method for probiotic enumeration. Flow cytometry offers faster turn-around times and reduced relative standard deviation compared to traditional plating methods. However, limitations also exist for flow cytometry applications.
Although immunotherapy is becoming a standard approach of human cancer treatment, only a small but critical fraction of patients responds to the therapy. It is therefore required to determine the sub-populations of patients who will respond to immunotherapies along with developing novel strategies...
Over the last decade, liquid biopsy has gained much attention as a powerful tool in personalized medicine since it enables monitoring cancer evolution and follow-up of cancer patients in real time. Through minimally invasive procedures, liquid biopsy provides important information through the analysis of circulating tumour cells (CTCs) and circulating tumour-derived material, such as circulating tumour DNA (ctDNA), circulating miRNAs (cfmiRNAs) and extracellular vehicles (EVs). CTC analysis has already had an important impact on the prognosis, detection of minimal residual disease (MRD), treatment selection and monitoring of cancer patients. Numerous clinical trials nowadays include a liquid biopsy arm. CTC analysis is now an exponentially expanding field in almost all types of solid cancers. Functional studies, mainly based on CTC-derived cell-lines and CTC-derived explants (CDx), provide important insights into the metastatic process. The purpose of this review is to summarize the latest findings on the clinical significance of CTCs for the management of cancer patients, covering the last four years. This review focuses on providing a comprehensive overview of CTC analysis in breast, prostate and non-small-cell lung cancer. The unique potential of CTC single-cell analysis for understanding metastasis biology, and the importance of quality control and standardization of methodologies used in this field, is also discussed.
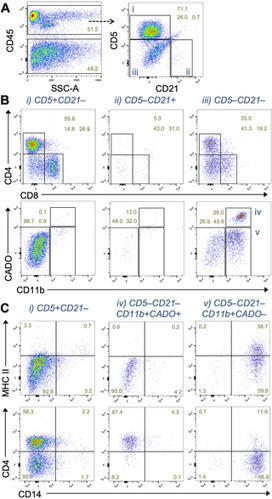
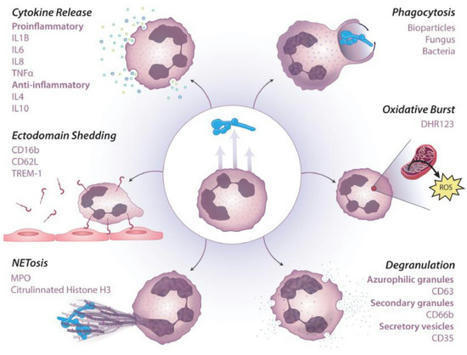
Neutrophils are a vital component of the innate immune system and play an essential function in the recognition and clearance of bacterial and fungal pathogens. There is great interest in understanding mechanisms of neutrophil dysfunction in the setting of disease and deciphering potential side...
This Flow Cytometry Course is aimed at both clinical applications and applications in cell biology and is open to all and is suitable for those who are relatively new to flow cytometry and who wish to expand their experience with applications and specific analysis.
Extracellular vesicles can provide a wealth of information, but these intriguing messengers are notoriously difficult to detect. This could be about to change.
Cancer-related deaths are mainly caused by metastatic spread of tumor cells from the primary lesion to distant sites via the blood circulation. Understanding the mechanisms of blood-borne tumor cell dissemination by the detection and molecular characterization of circulating tumor cells (CTCs) in th …
Same day processing of biospecimens such as blood is not always feasible, which presents a challenge for research programs seeking to study a broad population or to characterize patients with rare diseases.
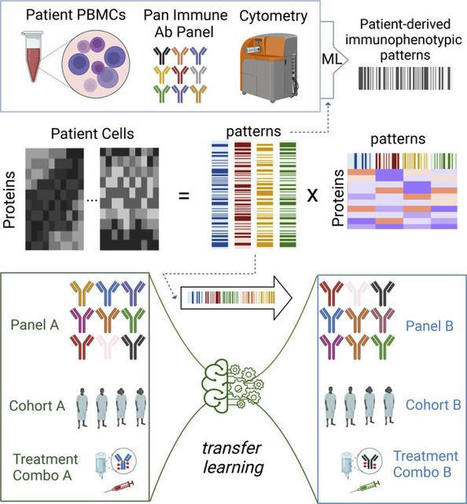
Single-cell proteomic pseudotemporal ordering of CD8+ T cells in patients with HIV inferred a trajectory of T cell exhaustion and described patient-level T cell states. Trajectory inference and pseudotime methods have demonstrated the ability to compute measurements of cell-state transitions along a biological process in scRNA-Seq data (16). We aimed to construct a quantitative metric of continuous phenotypic shifts associated with T cell activation and the transition from T effector to T memory cells from CyTOF data as functional biomarkers in patient immune responses. Using our framework a distribution of patient-specific T cell states to use as biomarkers (Figure 1). Given the well-established biology of T cell exhaustion in HIV infection, we first benchmarked the ability to use patient-specific summaries of T cell states based upon pseudotime analysis of publicly available CyTOF data for PBMCs of 24 treated and untreated patients with HIV and healthy controls (25). Figure 1Protein quantification of T cell states at the single-cell level. Workflow illustrating patient sample collection to data generation and computation of integrated metrics that can be projected across data sets. To define our T cell states, we ordered cells by selecting a naive (CCR7+CD45RA+) phenotype as the trajectory’s origin. We computed pseudotime weights of developmental T cell-state transitions, wherein 0 was representative of the selected origin and increasing weights corresponded with progression through the trajectory (Figure 2, A and B). Replicating the findings of Bengsch et al. (25), we found that the pseudotime trajectory associated with T cell exhaustion states defined by specific markers of T cell exhaustion, such as TOX and HELIOS, increased along pseudotime, while naive and activation markers, such as CD28, decreased (Figure 2C and Supplemental Figure 1). We then formed a patient-specific metric of expected T cell exhaustion using the mean pseudotime weight. Comparison of the pseudotime-based estimation of T cell exhaustion in each patient between healthy controls and infected patients in a t test demonstrated that healthy controls had significantly lower pseudotime compared with infected patients, indicative of a less exhausted profile, regardless of disease severity (t test, P < 0.001; Figure 2D). We also found that patients on antiretroviral therapy (ART) had overall intermediate pseudotimes compared with untreated patients and healthy controls, suggestive of a lingering exhaustion profile. Thus, these pseudotime trends corresponded with known HIV-associated T cell biology, reflecting decreased functionality consistent with increased expression of exhaustion-specific markers in T cells from patients with HIV, even those on ART with undetectable viral loads (27). Figure 2Protein quantification of T cell states at the single-cell level. (A) Protein expression of representative canonical T cell markers present in the HIV CyTOF panel. (B) Pseudotime trajectory computed using naive CD8+ T cells (Tc) as origin. (C) Fitted model of surface protein expression of cells ordered by pseudotime from naive Tc to exhausted (Tex), demonstrating transient expression of activation and exhaustion. (D) Pseudotime mean by patient across HIV status and treatment. Statistical significance was determined by group mean comparison t tests. (E) Clustering analysis projected on UMAP. (F) Dot plot of mean expression by cluster. (G) Bar plot showing compositionality by condition. (H–J) Box plots of proportion of each cluster by patient, grouped by condition. Statistical significance was determined by group mean comparison t tests. Statistically significant P values adjusted for multiple comparisons (Holm-Bonferroni) are shown as follows: *P < 0.05; **P < 0.01; ***P < 0.001. In parallel with pseudotime analysis, we also tested how clusters of CD8+ T cells distinguished by Leiden clustering can be used to compare the profiles across the different HIV groups. We identified 3 distinct clusters, one of which we annotated as “naive” (CCR7+) and the other 2 as “preexhaustion” and “exhausted” (HELIOS+, TOX+) based on their protein expression profiles (Figure 2, E and F). As expected, the proportion of cells belonging to the naive CD8+ T cell cluster was consistently lower in HIV-infected groups compared with that in healthy controls (t test, P < 0.001, Figure 2, G and H), whereas the preexhaustion CD8+ T cell cluster was significantly more abundant in the ART, intermediate, and severe groups (t test, P < 0.001) but not in the mild group (Figure 2, G and I). Interestingly, in this discrete clustering analysis, no significant differences were observed in the exhausted CD8+ T cell cluster (Figure 2J). In contrast to the single-cell trajectory presented above, which employed a data-wide exploration of continuous and progressive biological trends, the clustering analysis suggests that relying on clusters alone may result in an inconsistent or unnecessarily skewed interpretation of the data by relying on discrete measures, underestimating differences in certain populations while overestimating in others. CoGAPS patterns in CyTOF data generated integrated patterns of protein expression programs that also reflected T cell states at the patient level. To compute continuous integrated protein metrics that enhance the resolution of T cell trajectory inference, which may span multiple cell states, while replacing discrete classifications in clustering analyses, we applied CoGAPS (23, 24) to CyTOF data. CoGAPS infers patterns of biological activity by identifying coregulated sets of proteins and decomposing an expression matrix into 2 sets of factors: cell-level pattern weights, ranging from 0 to a maximum weight of 1, and their corresponding protein-level amplitudes. In the same HIV data set described above, we computed 3 patterns from the protein expression that we annotated as naive, preexhaustion, and exhaustion based on the average pattern weights for each CyTOF panel marker (Figure 3A). These patterns mirrored the pseudotemporal trajectory inferred in the uniform manifold approximation and projection (UMAP) embedding described above but provided greater resolution of distinct T cell states without requiring either trajectory inference or the assumption of monotonic changes along that trajectory (Figure 3B). We compared pattern weight means across patients and found that naive pattern weights were significantly higher in healthy controls compared with ART-treated patients with HIV (t test, P < 0.01) and untreated patients (t test, P < 0.001) (Figure 3C). ART-treated patients also had significantly higher naive pattern weights compared with patients with intermediate and severe disease (t test, P < 0.05) but not compared with those with mild disease. Preexhaustion pattern weights indicated no differences among patients across groups (Figure 3D). Exhaustion pattern weights, however, mirrored the pseudotime-based results (Figure 3E). Specifically, healthy control patients exhibited significantly lower exhaustion pattern weights compared with patients with HIV (t test, P < 0.01, ART; P < 0.001, untreated). ART-treated patients also had significantly lower exhaustion pattern weights compared with untreated patients (t test, P < 0.001). Figure 3NMF can reveal biologically descriptive patterns of protein expression in CyTOF data. (A) Heatmap showing relative expression of protein markers in patterns generated using CoGAPS. (B) CD8+ T cells from the HIV data set represented in a UMAP overlaid with pattern weights. (C) Naive pattern–, (D) preexhaustion-, and (E) exhaustion-related pattern weight means by patient across conditions. Statistical significance was determined by group mean comparison t tests. Statistically significant P values adjusted for multiple comparisons (Holm-Bonferroni) are shown as follows: *P < 0.05; **P < 0.01; ***P < 0.001. Similar to marker coexpression patterns identified from CoGAPS, analysis of single markers identified significant differences between patient groups. However, this was only observed for some markers, such as CD28 and TOX, but not for others, such as PD-1 and HELIOS (Supplemental Figure 2). This demonstrates that integrated T cell patterns can highlight both drivers of differential phenotypes as well as coexpressed or coregulated genes with a contribution to phenotype that might be missed at the single-gene level. Overall, these results provide a proof of concept that integrated metrics of patient-specific T cell states derived from pseudotime weights or CoGAPS patterns based on mass cytometry profiling can be employed to evaluate immunological contexts. CyTOF-based integrated T cell metrics can be directly used to describe clinically meaningful attributes in patients with PDAC treated with ipilimumab and GVAX. In addition to comparing T cell states in general, we aimed to determine the translational utility of CyTOF-based T cell metrics for individual patients defined by both trajectory inference and NMF using a time-course data set in the context of cancer immunotherapy. Specifically, we hypothesized that our CyTOF analysis approach could identify continuous Th cell and cytotoxic T (Tc) cell trajectories of antigen experience, including naive, memory, and effector T cell states, during immunotherapy. We previously generated CyTOF data using PBMCs from patients with PDAC treated with ipilimumab, a checkpoint immunotherapy targeting CTLA-4, and a GM-CSF–secreting allogeneic pancreatic cancer vaccine (GVAX). PBMCs were profiled at baseline and 7 weeks after treatment to monitor systemic immune responses across time (28). As done for the HIV data set, we first performed dimension reduction on the protein level to generate a UMAP representation of the CyTOF data (Figure 4A). The pan-immune panel used in the study yielded 4 distinct clusters belonging to T cells, NK cells, B cells, and myeloid cells (Figure 4B). Next, we subsetted Tc and Th cells and computed separate immune pseudotemporal trajectories (Figure 4, C and D). Again, ordering the cell trajectories by selecting naive cells (CCR7+CD45RA+) as the origin and computing pseudotime weights, we found that the protein expression of memory and effector markers increased with pseudotime following a transition from naive to memory and effector T cell states. In corroboration, we also computed CoGAPS patterns, identifying 3 patterns that were annotated as naive, memory, and effector based on the pattern weights of key markers (Figure 5A). These protein-expression patterns also corresponded well with their respective topologies when overlaid on the CyTOF UMAP (Figure 5B). Figure 4CyTOF integrated metrics recapitulate T cell differentiation from naive to effector phenotypes in peripheral blood of patients receiving cancer immunotherapy. (A) UMAPs colored by protein expression canonical markers representing major immune lineages in PBMCs from patients with PDAC undergoing ipilimumab and GVAX combination immunotherapy. (B) Annotated UMAP. (C and D) Pseudotime trajectory and fitted models of protein expression by pseudotime in CD8+ and CD4+ T cells, respectively. Figure 5Integrated CyTOF metrics generated using CoGAPS have clinical utility. (A) Heatmap of relative marker protein expression in NMF patterns generated by CoGAPS in CyTOF data in peripheral blood T cells from patients with PDAC. (B) CD8+ Tc and CD4+ Th cell UMAPs colored by pattern weights. (C) Correlations between pseudotime methods and NMF patterns in Tc cells. (D) Mean Th cell pseudotime by patient at baseline and 7 weeks of treatment with ipilimumab and GVAX. (E and F) Memory pattern weight means by patients across time points and treatment response (SD, stable disease; NB, no benefit) in Th cell and Tc cells, respectively. (G) Comparison of overall survival (OS) by months in patients with PDAC with high Th cell effector pattern weight mean versus low Th cell effector pattern mean. Statistical significance was determined by (D) group mean comparisons, paired t tests for line plot; (E and F) unpaired t tests in box plots; and (G) Cox proportional hazards regression model in survival plot. Statistically significant P values adjusted for multiple comparisons (Holm-Bonferroni) are shown as follows: *P < 0.05; **P < 0.01; ***P < 0.001. To determine the sensitivity of these findings with the analysis method selected to generate the metrics, we compared these results with those of other trajectory inference methods recommended by dynverse, a tool that compiles trajectory inference methods and suggests those most appropriate for the data and trajectories of under study (15). Using the PDAC Tc cell population across patients from both time points, we evaluated the correlations among the results based on Monocle3, Waterfall, Comp1, Tscan, and Scorpius (16, 29–32), confirming that pseudotime weights quantifying memory to effector transitions significantly correlated with each other (Spearman’s, P < 0.001) and were consistent across methods (Figure 5C). We also compared these weights from the different trajectory inference methods to the naive, memory, and effector CoGAPS patterns and confirmed that the memory pattern was positively correlated with pseudotime (Spearman’s r, 0.16 to 0.84, P < 0.001), whereas the naive pattern was negatively correlated with pseudotime (Spearman’s r, –0.19 to –0.79, P < 0.001) and the effector pattern was overall less correlated with pseudotime across methods (Spearman’s r, –0.018 to 0.01, P < 0.001). The availability of pre- and posttreatment profiles in this data set enabled us to evaluate whether these T cell metrics can reflect the changes in T cell states resulting from therapy. Overall, we found that Th cell pseudotime weights significantly increased after 7 weeks of therapy (2 treatments of vaccine plus ipilimumab 3 weeks apart) in these patients (paired t test, P < 0.0001), suggesting a positive shift in Th cell activation or antigen experience (Figure 5D). This was also observed with CoGAPS-inferred Th and Tc cell memory pattern weights, which also increased after 7 weeks of treatment (t test, P < 0.01, Th cell; P < 0.05, Tc cell) (Figure 5, E and F). To test the potential of associating CyTOF-based T cell metrics with patient outcomes, we used a Cox proportional hazards model to compare overall patient survival of binarized groups defined using the median of T cell metrics means at baseline. Even with a small sample size, our analysis demonstrated that patients with higher Th cell effector pattern weights exhibited significantly increased overall survival (Cox, P < 0.05; HR, 5.36) (Figure 5G). Altogether, these results suggest that our approach can effectively quantify shifts in T cell states during immunotherapy and lead to correlates of clinical outcomes. Continuous CyTOF metrics can be projected across data sets to efficiently query patterns associated with clinical features of disease and patient outcomes. To further extend the utility of CyTOF workflows, particularly in the setting of analyzing disparate immunotherapy studies, we next sought to determine whether other data sets can be projected into the previously learned functional states from a CyTOF data set. Leveraging the integrated CyTOF signatures found in our PDAC study, we employed transfer learning of those metrics to 2 additional independent CyTOF data sets using projectR, our transfer learning tool to project cell state patterns learned from matrix factorization to query their occurrence in new data sets (13, 33, 34). First, we projected a CyTOF data set we previously generated with the same antibody panel but in patients with HCC treated with nivolumab who presented either with nonviral etiologies, treated hepatitis infections, or active hepatitis infections (35) into the CoGAPS T cell patterns from the PDAC study. This data set allowed us to explore whether T cell profiles affected by a different immunologic context, i.e., the different viral histories across patients, could be compared by transfer learning of integrated T cell signatures. Using the CoGAPS patterns learned in the PDAC CyTOF data set led to the rapid characterization of T cells in the HCC cohorts without the need for any manual annotations (Figure 6A). Upon transfer learning, we observed that the resulting effector pattern weights in the projected target data were significantly increased in CD8+ T cells from patients with HCC with active viral hepatitis infections compared with those with prior hepatitis infections who were treated effectively with antiviral therapies (t test, P < 0.05) (Figure 6B). Figure 6CyTOF integrated metrics can be projected across distinct patients, diseases, and immunological scenarios to annotate newly generated data sets and query proteomic outcomes-associated signatures. (A) CCR7 expression. NMF patterns from the PDAC CyTOF data set projected onto different cohorts of patients with HCC treated with nivolumab and patients with melanoma treated with ipilimumab. (B) Projected memory pattern weights in CD8+ T cells by response of patients with melanoma to ipilimumab, showing significantly increased means in responders at baseline. (C) Projected effector pattern weights in CD8+ T cells by patients with HCC disease etiology, showing significantly different means between treated and untreated viral status. Statistical significance was determined by group mean comparison t tests. Statistically significant P values adjusted for multiple comparisons (Holm-Bonferroni) are shown as follows: *P < 0.05; **P < 0.01. Second, we projected a publicly available CyTOF data set from patients with melanoma treated with ipilimumab (5). Because this data set was generated with a different antibody panel for T cell phenotyping and contained annotations of clinical responses to ipilimumab, the data set was particularly useful for testing whether transfer learning using the T cell signatures could tolerate nominal differences in the antibody panel and whether they can associate with clinical outcomes in another study. Again, using the CoGAPS patterns from the PDAC CyTOF data set (Figure 6A), we were able to observe that projected CD8+ T cells from patients with melanoma who clinically responded to ipilimumab therapy (t test, P < 0.01) (Figure 6C) were significantly increased in the previously learned memory pattern. This was consistent with the interpretations from the study based on analyzing discrete cell subtype abundances, showing higher frequencies of CD8+ T effector memory subsets (5). In a separate validation analysis, we repeated CoGAPS learning of T cell patterns directly from these data sets and found signatures consistent with naive and effector phenotypes and canonical single protein markers (Supplemental Figure 3 and Supplemental Figure 4). Altogether, these results demonstrate a practical and integrated workflow using CyTOF profiling for empowering immunologic cross comparisons, particularly in the setting of multiple immunotherapy clinical studies.
Your guide to the most essential developments in life sciences...
Flow cytometry has the potential to facilitate understanding the heterogenous responses of diverse brain cell populations to a variety of stimuli. However, existing methods of applying flow cytometry to brain tissues are each limited in certain ways.
Identification and enumeration of circulating tumor cells (CTCs) in peripheral blood are proved to correlate with the progress of metastatic cancer and can provide valuable information for diagnosis and monitoring of cancer.
|