Your new post is loading...
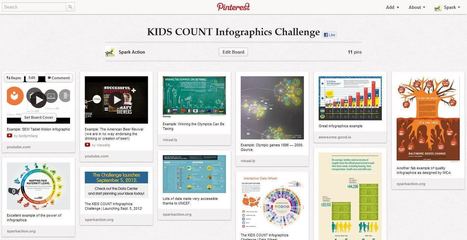
"A great presentation is more than just a vehicle for delivering facts and information. You know this because when you've witnessed a great one you've walked away entertained, refreshed, and inspired.
Chances are you'll remember certain things about it that really resonated with you, and you'll find it much easier to retain the content because it was offered to you in such a unique way. Great presentations are a combination of carefully chosen visuals, concisely plotted information, and often a very simple approach meant to connect to an audience rather than overwhelm them with bullet points and embedded media. In such presentations, everything has a purpose and place.
Often students are called upon to make presentations for class projects, and many are eager to break out of the mold of the standard PowerPoint and do something really special. These are 8 unique online presentation tools that will help your students do exactly that. From zooming presentations to animations to timelines, there's a little something for every great idea here."
Via Dennis Richards
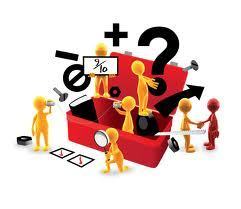
There are a couple tools out now that I see bantered around in educational circles that I just hate! And there are some pretty awesome tools out there that are being used in rather old and traditional ways, and I don’t hate the tool, but I hate the use of them.
Via Nik Peachey, sofilab
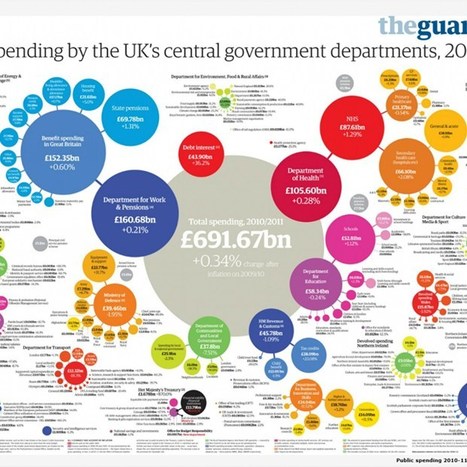
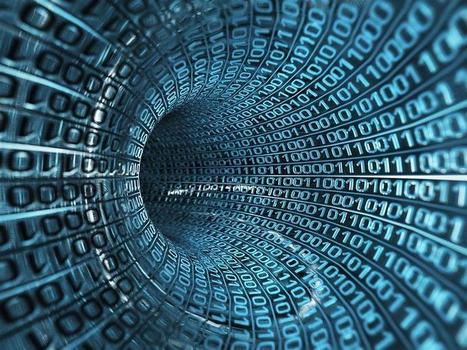
From simple charts to complex maps and infographics, Brian Suda's round-up of the best – and mostly free – tools has everything you need to bring your data to life... A common question is how to get started with data visualisations. Beyond following blogs, you need to practice – and to practice, you need to understand the tools available. In this article, get introduced to 20 different tools for creating visualisations: from simple charts to complex graphs, maps and infographics. Almost everything here is available for free, and \you may have installed already...
Via Lauren Moss, sofilab
On September 27th, the world's best examples of visually stunning information was recognized at the inaugural Information is Beautiful awards. The event, held at London's Institute of Contemporary Arts, awarded designers from all over the world in a variety of categories, including data visualisation, infographics and data journalism. When David McCandless, author, data journalist and founder of the IIB data-visualisation studio, announced in early 2012 that IIB was looking for award applicants, he was inundated with over 1,000 entries. "I've just been amazed by the sheer quality of the creative work submitted to the awards from around the world," McCandless told Wired.co.uk. "There are a number of criteria we look for when judging these awards. Not only do they have to have the right visual quality and be easily understood, they have to have that invisible element of story telling as well." Read the complete article for a closer look at all the winners, selected by a panel of judges including musician and visual artist Brian Eno, senior curator of the Museum of Modern Art Paola Antonelli, BrainPickings.org editor Maria Popova and Guardian Datablog editor Simon Rogers.
Via Lauren Moss, Beth Kanter
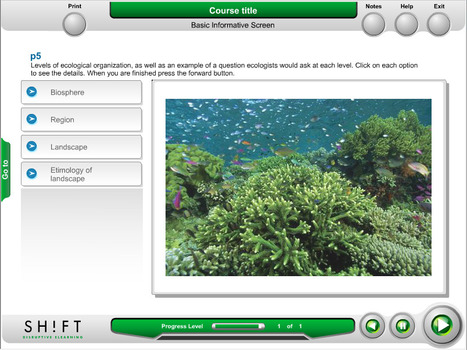
The one place for teachers to create and deliver lessons digitally...
Via sofilab
Sponsors | Social Media Samples | Logos & Buttons | Press Release | Contacts ...
Via Beth Kanter
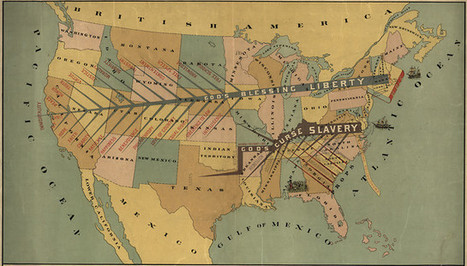
We live in a world steeped in graphic information. From Google Maps and GIS to the proliferation of infographics and animated maps, visual data surrounds us. While we may think of infographics as a relatively recent development to make sense of the immense amount of data available on the Web, they actually are rooted in the 19th century. Two major developments led to a breakthrough in infographics: advances in lithography and chromolithography, which made it possible to experiment with different types of visual representations, and the availability of vast amounts of data, including from the American Census as well as natural scientists, who faced heaps of information about the natural world, such as daily readings of wind, rainfall, and temperature spanning decades. But such data was really only useful to the extent that it could be rendered in visual form. And this is why innovation in cartography and graphic visualization mattered so greatly...
Via Lauren Moss, Beth Kanter
Thanks to my colleague - Conrad Taylor - for signposting this.
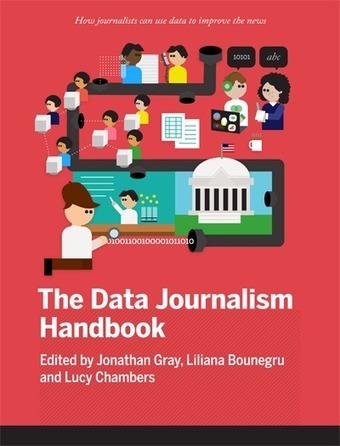
Currently in Beta, The Data Journalism Handbook is an incredibly rich resource for anyone interested in finding information (and a story) from data. What is data journalism? To quote from the authors: "Perhaps it is the new possibilities that open up when you combine the traditional‘nose for news’ and ability to tell a compelling story, with the sheer scale and range of digital information now available." But you don't need to be a professional journalist to be able to see the value in this handbook. There are tips and good practice here for anyone using the Interweb for research. Whether you are an 'armchair auditor' checking on how government is spending your money, or a researcher looking for patterns of poor healthcare, or you're just interested in finding connections between hundreds of thousands of documents, as The Telegraph did in revealing the scandal of with MPs' expenses. You'll find some useful tips here, together with examples and case studies of stories (scandals even) that have surfaced as a result of knowing your rights to open data as a private citizen, where to find the data sources, and how to use and understand data. The authors are also behind the website at: http://datadrivenjournalism.net/ Value: 9/10
Via Stephen Dale, Beth Kanter
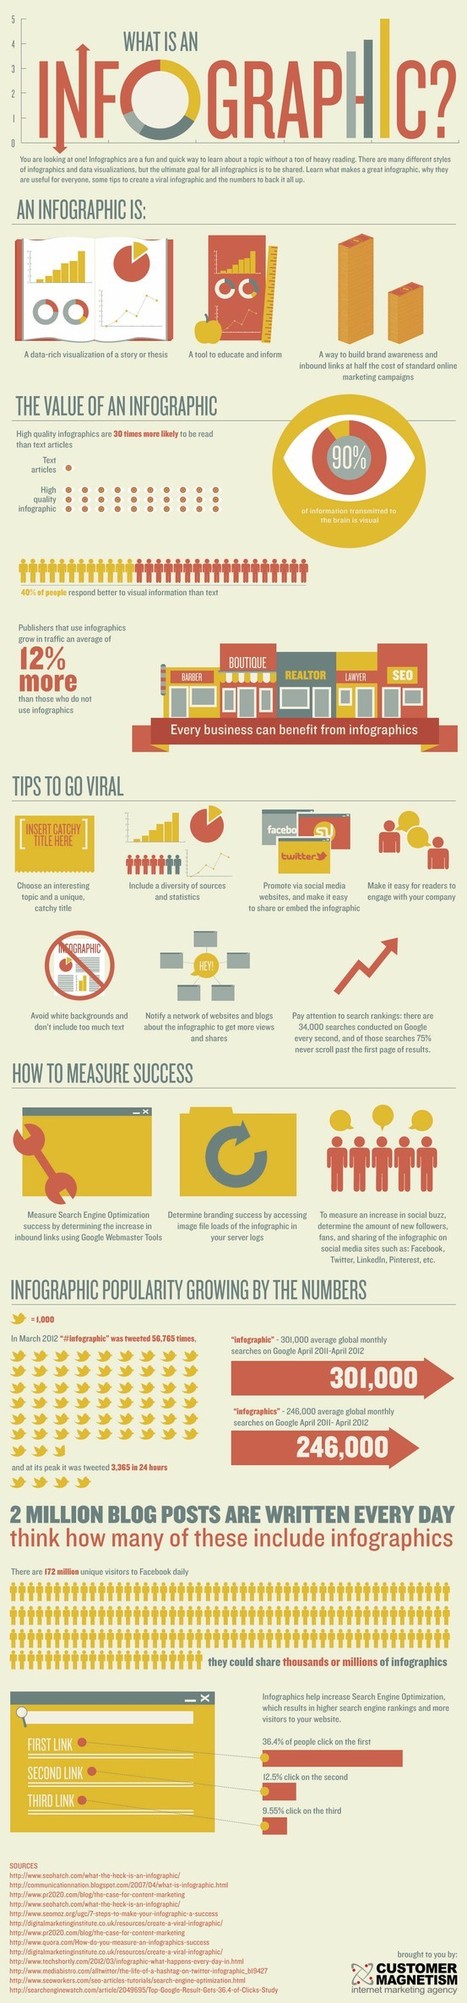
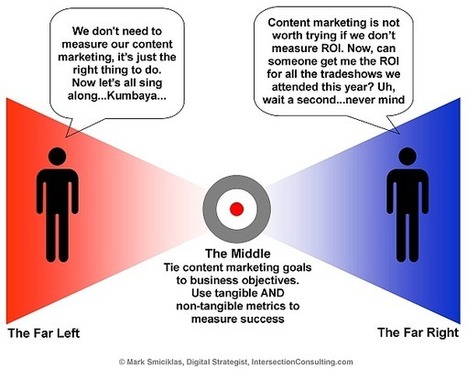
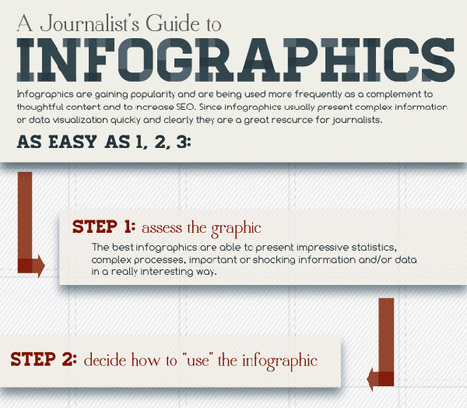
Curated by Beth Kanter http://www.bethkanter.org This infographic explains what an infographic is, the value of an infographic, and how to measure it. It also includes some numbers.
Via Beth Kanter
Looking for the best tool to use to make a Gantt chart? Find out more about what Gantt charts are, who Henry Gantt was, as well as how to make Gantt charts in Microsoft Excel, Microsoft Powerpoint, Microsoft Access and Google Docs.
Via Dr. Susan Bainbridge
Whether you are looking for a master’s degree program, computer science classes, a K-12 curriculum, or GED study program, this list gives you50 Top Sources Of Free eLearning Courses -
Via Dr. Susan Bainbridge
|
This site is an amazing geometry playground for maths students and teachers. Select points on your screen and connect them up to provide the properties you what. This resource uses HTML5 and works wonderfully across a range of computers, browsers and tablets. http://ictmagic.wikispaces.com/Maths
Via Dennis Richards
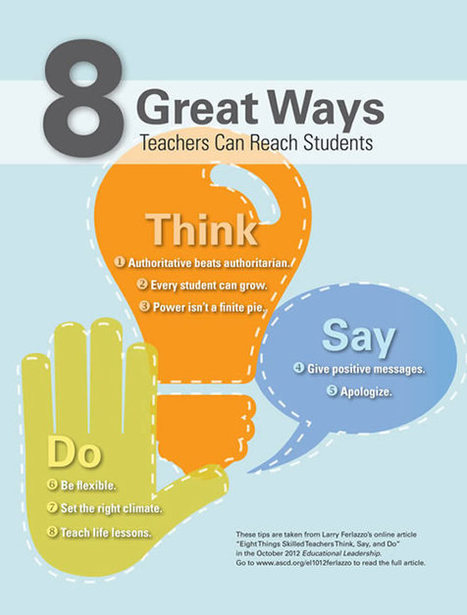
An article from Educational Leadership on "how to engage students whom seem unreachable, who resist learning activities, or who disrupt them for others." Larry Ferlazzo reflects on his yers of teaching and shares ways he engages students by developing "their intrinsic motivation." The post provides eight detailed recommendations. The infographic above shares the short hand version!
Via Beth Dichter, sofilab
7th Annual Media Maven Luncheon hosted by CCTV & Common Good Vermont Burlington, Vermont 21 September 2012...
Via Beth Kanter
73 free and beautiful designer quality Microsoft excel charting templates, bold, intuitive and easy to use, grab them now and make your Bar, Pie Charts beautiful...
Via Dr. Susan Bainbridge
|