Journalisme graphique
142.0K views | +0 today
Journalisme graphique
La veille de Wedodata, studio de datavisualisations : wedodata.fr
Curated by Karen Bastien
Your new post is loading...
Scooped by Karen Bastien
Scoop.it!

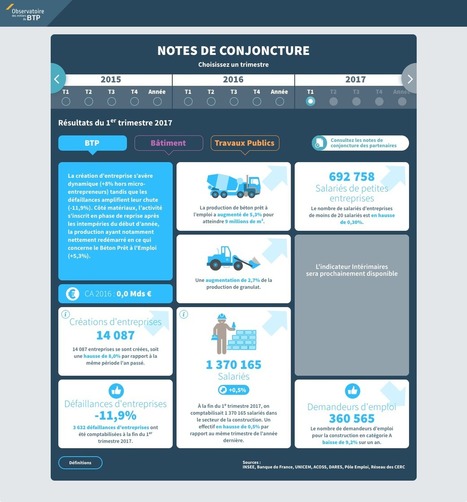
Wedodata - Notes de conjoncture du secteur BTP

Wedodata - Notes de conjoncture du secteur BTP | Journalisme graphique | Scoop.it
Agence/Studio de dataviz et datajournalisme, fondé par Karen Bastien et François Prosper.
Projets sur-mesure depuis l'analyse de la data jusqu'au développement web en passant par la création graphique.
Dans tous les formats : print / web / vidéo / photo
No comment yet.
Scooped by Karen Bastien
Scoop.it!

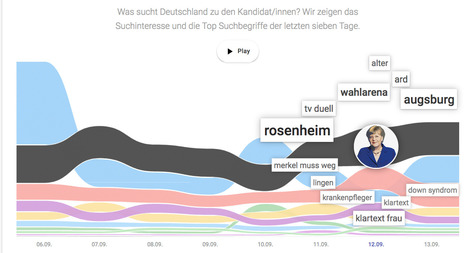
Elections allemandes : que cherchent les Allemands sur Google ? 

Elections allemandes : que cherchent les Allemands sur Google ?  | Journalisme graphique | Scoop.it
Was interessiert Deutschland im Superwahljahr? Wahl 2Q17 zeigt das Google Suchinteresse zu den Spitzenkandidat/innen der sieben meistgesuchten Parteien der Bundestagswahl 2017. Von Moritz Stefaners Truth & Beauty mit Unterstützung des Google News Lab.
No comment yet.
Scooped by Karen Bastien
Scoop.it!

Sciences : quels pays collaborent le plus ?

Sciences : quels pays collaborent le plus ? | Journalisme graphique | Scoop.it
The Nature Index tracks the affiliations of high-quality scientific articles. The infographic indicates patterns of international collaboration captured by the Nature Index.
No comment yet.
Scooped by Karen Bastien
Scoop.it!

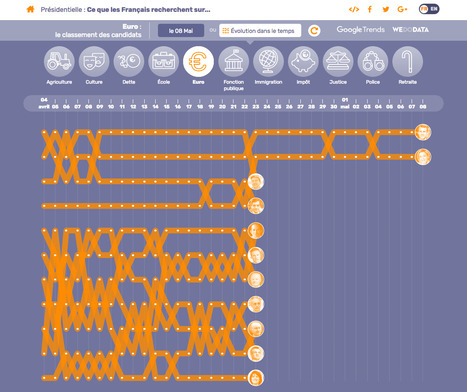
Présidentielle : Ce que les Français recherchent sur Google

Présidentielle : Ce que les Français recherchent sur Google | Journalisme graphique | Scoop.it

Retrouver l’intensité des recherches Google associées aux candidats aux élections présidentielles 2017 pendant le mois de la campagne officielle : vision quotidienne ou historique sur 11 thèmes différents

No comment yet.
Scooped by Karen Bastien
Scoop.it!

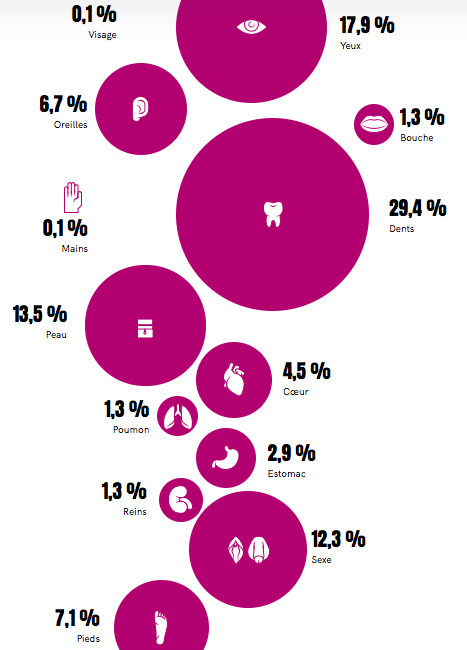
Baromètre santé PagesJaunes 2016

Baromètre santé PagesJaunes 2016 | Journalisme graphique | Scoop.it
Petites habitudes et grands maux : PagesJaunes passe la santé des Français au rayon X
No comment yet.
Scooped by Karen Bastien
Scoop.it!

On the Trump Emoto-Coaster

On the Trump Emoto-Coaster | Journalisme graphique | Scoop.it
The Trump Emoto-Coaster: As shown in ten of the major speeches he gave from July through December, there’s a rise and fall of intense emotion: anger, contempt, disgust, fear, sadness, happiness and surprise.
No comment yet.
Scooped by Karen Bastien
Scoop.it!

D’où vient la visualisation de données ? 

D’où vient la visualisation de données ?  | Journalisme graphique | Scoop.it

Fabrice Sabatier PhD

Patrice Mitrano's curator insight, January 18, 2017 10:42 AM
Un poster très instructif par Fabrice Sabatier, graphiste.
Scooped by Karen Bastien
Scoop.it!

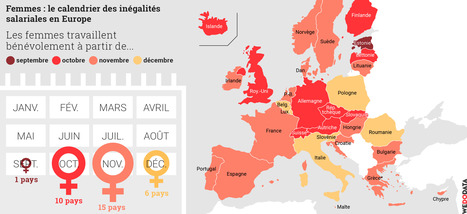
INFOGRAPHIE. À quelle date les femmes commencent-elles à «travailler bénévolement» en Europe?

INFOGRAPHIE. À quelle date les femmes commencent-elles à «travailler bénévolement» en Europe? | Journalisme graphique | Scoop.it
Pour mieux comprendre les inégalités salariales, plusieurs collectifs ont mis en avant des dates à partir desquelles les femmes ne gagnent plus d'argent.
Scooped by Karen Bastien
Scoop.it!

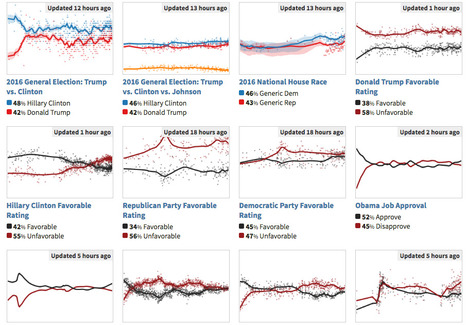
HuffPost tracks thousands of polls 

HuffPost tracks thousands of polls  | Journalisme graphique | Scoop.it
HuffPost Pollster tracks thousands of public polls to give you the latest data on elections, political opinions and more.
No comment yet.
Scooped by Karen Bastien
Scoop.it!

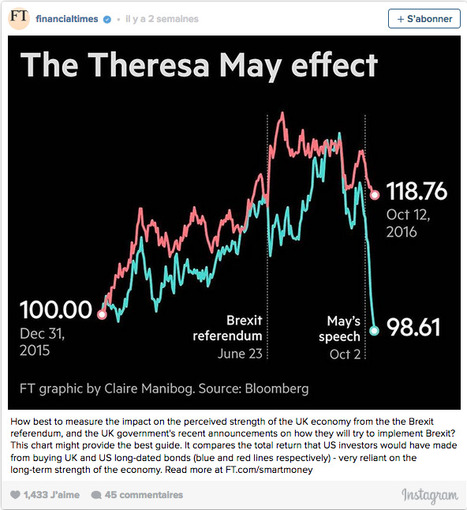
Chart porn : comment gagner 250000 followers sur Instagram ?

Chart porn : comment gagner 250000 followers sur Instagram ? | Journalisme graphique | Scoop.it
The FT has grown its Instagram following from 40,000 to 286,000 in less than a year.
No comment yet.
Scooped by Karen Bastien
Scoop.it!

Présidentielles US : suivre un débat en scrollant

Présidentielles US : suivre un débat en scrollant | Journalisme graphique | Scoop.it
Hillary Clinton v Donald Trump: all the clashes, questions, interruptions and flashpoints of the showdown in Las Vegas
No comment yet.
Scooped by Karen Bastien
Scoop.it!

Rapports Data 2015 | Fondation Alliance française

Rapports Data 2015 | Fondation Alliance française | Journalisme graphique | Scoop.it

Conception et réalisation @we_do_data

No comment yet.
Scooped by Karen Bastien
Scoop.it!

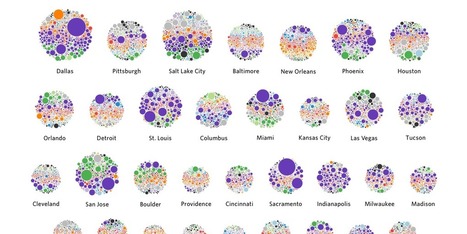
The Entire History of Kickstarter Projects, by City

The Entire History of Kickstarter Projects, by City | Journalisme graphique | Scoop.it
Using Kickstarter Projects to Identify Where Creative Communities Live in the US
No comment yet.
Scooped by Karen Bastien
Scoop.it!

The Stories Behind a Line

The Stories Behind a Line | Journalisme graphique | Scoop.it

a visual narrative of six asylum seekers' routes

No comment yet.
Scooped by Karen Bastien
Scoop.it!

Data Literacy Conference 2017

Data Literacy Conference 2017 | Journalisme graphique | Scoop.it

Dans les entreprises et les administrations, à l’école, dans la recherche comme dans la société, la capacité de produire, comprendre et utiliser des données numériques devient une compétence essentielle. Avec les meilleurs experts mondiaux, Data Literacy Conference délivre les clés d’une « culture de la donnée » enfin accessible aux non-spécialistes.

Si les « data » sont aujourd’hui un puissant vecteur de développement économique, de capacitation citoyenne ou encore, de production de connaissances, elles suscitent également des inquiétudes légitimes, ainsi que des luttes de pouvoir. L’idée montante d’une « littératie » des données consiste à permettre à tout décideur, collaborateur, innovateur, entrepreneur, chercheur ou citoyen d’en comprendre les enjeux, d’en discuter les sources et les usages, et d’en tirer parti dans sa propre activité.

No comment yet.
Scooped by Karen Bastien
Scoop.it!

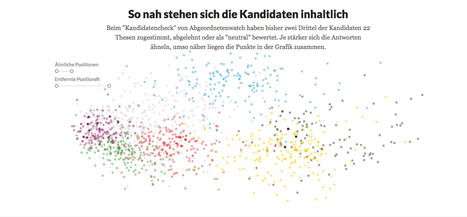
Elections allemandes : portrait data des candidats

Elections allemandes : portrait data des candidats | Journalisme graphique | Scoop.it
Jeder Kandidat ein Punkt. Diese Übersicht zeigt alle 2559 Bewerber, die per Erststimme in den nächsten Bundestag einziehen wollen - und wofür sie stehen.
No comment yet.
Scooped by Karen Bastien
Scoop.it!

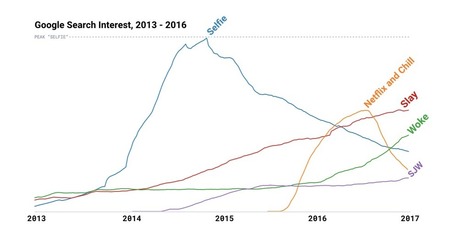
Les mots recherchés sur Google en 2016

Les mots recherchés sur Google en 2016 | Journalisme graphique | Scoop.it
What were the trending definitions of 2016? From “selfie” to “woke,” Google searches reveal how we adopt new language
No comment yet.
Scooped by Karen Bastien
Scoop.it!

Quiz de l'énergie des communes

Quiz de l'énergie des communes | Journalisme graphique | Scoop.it

Création @we_do_data : En une quinzaine de questions, les responsables de collectivités peuvent découvrir quel est leur profil d'engagement en matière d'efficacité énergétique. Réalisé pour des fédérations professionnelles, ce quiz montre comment valoriser une étude sous une forme interactive et implicante.

No comment yet.
Scooped by Karen Bastien
Scoop.it!

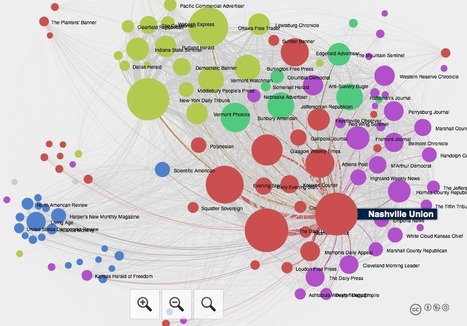
How newspaper stories went viral in the 19th century - Storybench

How newspaper stories went viral in the 19th century - Storybench | Journalisme graphique | Scoop.it
Ryan Cordell wants to know how news went viral in 19th century America. Cordell, a professor in the English department at Northeastern University, performs this pop culture archaeology by investigating the culture of reprinting, a practice which was rampant in 19th century newspapers. Back then it was not only news, but poems, articles, serialized fiction, and anecdotes that were reprinted–or …
No comment yet.
Scooped by Karen Bastien
Scoop.it!

Etats-Unis : et si les Etats étaient des graphiques

Etats-Unis : et si les Etats étaient des graphiques | Journalisme graphique | Scoop.it
Within swing states states are counties where many voters have switched the party they support, and that could prove decisive Tuesday.
No comment yet.
Scooped by Karen Bastien
Scoop.it!

Geographical mapping of Google suggestions

Geographical mapping of Google suggestions | Journalisme graphique | Scoop.it
Zeitgeist Borders allows to one to project Google suggestions on a word map according to the language they are generated for.
No comment yet.
Scooped by Karen Bastien
Scoop.it!

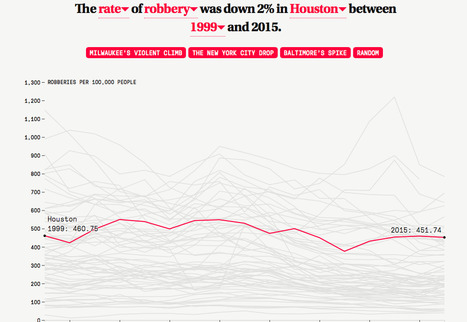
Etats-Unis : explorer les stats de la criminalité

Etats-Unis : explorer les stats de la criminalité | Journalisme graphique | Scoop.it
Violent crime is up in some places, but is it really a trend?
No comment yet.
Scooped by Karen Bastien
Scoop.it!

Todas las mentiras de Trump y Clinton frente a frente y en un vistazo

Todas las mentiras de Trump y Clinton frente a frente y en un vistazo | Journalisme graphique | Scoop.it
Hillary Clinton y Donald Trump debatieron por tercera y última vez en esta elección presidencial. ¿Cuál de los dos fue más fiel a la verdad? ¿Quién mintió más? El equipo del Detector de Mentiras de Univision te lo muestra en un vistazo.
No comment yet.
Scooped by Karen Bastien
Scoop.it!

Why we are doing fewer interactives (New York Times)

Why we are doing fewer interactives (New York Times) | Journalisme graphique | Scoop.it

par Archie Tse, Deputy graphics editor au New York Times

No comment yet.