Journalisme graphique
142.0K views | +0 today
Journalisme graphique
La veille de Wedodata, studio de datavisualisations : wedodata.fr
Curated by Karen Bastien
Your new post is loading...
Scooped by Karen Bastien
Scoop.it!

Guardian : toutes les datas du datablog !

Guardian : toutes les datas du datablog ! | Journalisme graphique | Scoop.it
All the data we have reported including all spreadsheets, authors, number of comments and retweets...
No comment yet.
Scooped by Karen Bastien
Scoop.it!

Tout savoir sur HTML5 et sa compatibilité

Tout savoir sur HTML5 et sa compatibilité | Journalisme graphique | Scoop.it
No comment yet.
Scooped by Karen Bastien
Scoop.it!

See UK :: Compare your neighbourhood

See UK :: Compare your neighbourhood | Journalisme graphique | Scoop.it
See UK is a simple visualisation allowing you to compare neighbourhood data in the UK which has been made available in Linked Open Data formats...
No comment yet.
Scooped by Karen Bastien
Scoop.it!

How Can Jeans Cost $300?

How Can Jeans Cost $300? | Journalisme graphique | Scoop.it
Shoppers Shell Out More for Designer Denim, Lured by Signature Details, 'Made in America'...
No comment yet.
Rescooped by Karen Bastien from datavisualization
Scoop.it!

57% of online consumers will abandon a site after waiting 3 seconds for a page to load.

57% of online consumers will abandon a site after waiting 3 seconds for a page to load. | Journalisme graphique | Scoop.it

Via audrey L
No comment yet.
Scooped by Karen Bastien
Scoop.it!

Classement international 2011 "Open Data et Open Government"

Classement international 2011 "Open Data et Open Government" | Journalisme graphique | Scoop.it
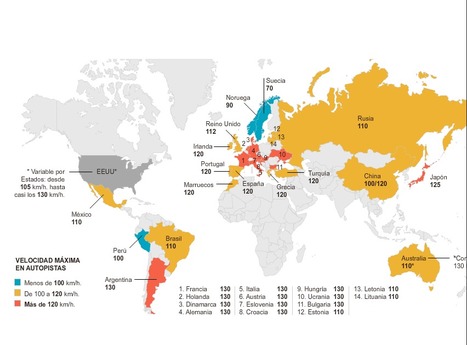
iFRAPClassement international 2011 "Open Data et Open Government"iFRAPEn réalisant ce classement, nous avons voulu mettre à jour une hiérarchie entre les pays en fonction non pas uniquement de leur conversion à la « libération des données...
No comment yet.
Scooped by Karen Bastien
Scoop.it!

Les mégapoles dans le monde

Les mégapoles dans le monde | Journalisme graphique | Scoop.it
La surface de la ville de Moscou sera à terme multipliée par 2,4 grâce à l'incorporation de 144.000 hectares de territoires situés au sud-est de la capitale, a annoncé le maire de Moscou, Sergueï Sobianine, le 11 juillet 2011.
No comment yet.
Scooped by Karen Bastien
Scoop.it!

Carte des catastrophes naturelles et humaines en temps réel dans le monde

Carte des catastrophes naturelles et humaines en temps réel dans le monde | Journalisme graphique | Scoop.it
This is a Emergency and Disasters Information and monitoring services. Hosted by National Association of Radio-distress signalling and Infocommunications.
No comment yet.
Scooped by Karen Bastien
Scoop.it!

Nouveau site : Visual.ly

Nouveau site : Visual.ly | Journalisme graphique | Scoop.it
visual.ly - Create, Share, Explore Great Visualizations.
No comment yet.
Scooped by Karen Bastien
Scoop.it!

TenderNoise Project | Movity.com

TenderNoise Project | Movity.com | Journalisme graphique | Scoop.it
Le bruit dans un quartier de San Francisco ausculté au plus fin. Une dataviz impressionnante
No comment yet.
Scooped by Karen Bastien
Scoop.it!

La pyramide inversée du datajournalisme

La pyramide inversée du datajournalisme | Journalisme graphique | Scoop.it
Compile, clean, context, combine....
No comment yet.
Scooped by Karen Bastien
Scoop.it!

In Graphics Issue 2

In Graphics Issue 2 | Journalisme graphique | Scoop.it
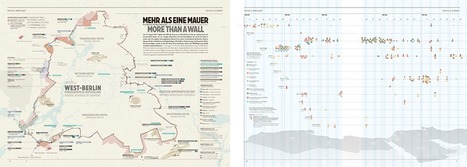
The Berlin-based design studio Golden Section Graphics recently released their second edition of IN GRAPHICS. The magazine explores visually 9/11, the Berlin Wall, Fukushima and a wide range of other topics.
No comment yet.
Scooped by Karen Bastien
Scoop.it!

L'Europe de l'énergie

L'Europe de l'énergie | Journalisme graphique | Scoop.it
Emissions de CO2, part des énergies renouvelables....
No comment yet.
Scooped by Karen Bastien
Scoop.it!

Phone-hacking scandal: Who's who - interactive

Phone-hacking scandal: Who's who - interactive | Journalisme graphique | Scoop.it
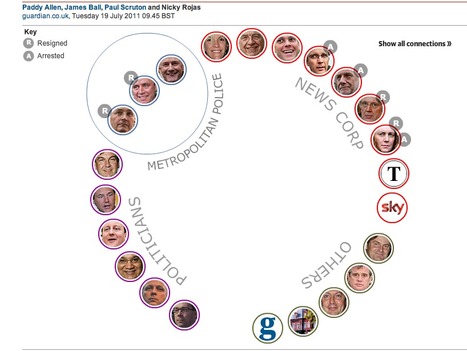
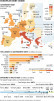
As another public figure resigns in the wake of the phone-hacking scandal, we look at the tangled web that links various individuals. Roll over the faces ...
No comment yet.
Rescooped by Karen Bastien from In bed with data
Scoop.it!

Pour une politique ambitieuse des données publiques

Rapport de l'Ecole des Ponts ParisTech sur l'ouverture et la réutilisation des données publiques, remis au Ministre de l'Industrie, de l'Energie et de l'Economie numérique le 13 juillet 2011..
Via lrtrln
No comment yet.
Scooped by Karen Bastien
Scoop.it!

US : l'incroyable chute de la consommation des ménages

US : l'incroyable chute de la consommation des ménages | Journalisme graphique | Scoop.it
What consumers are cutting back on....
No comment yet.
Scooped by Karen Bastien
Scoop.it!

How Twitter tracked the News of the World scandal | Media | guardian.co.uk

How Twitter tracked the News of the World scandal | Media | guardian.co.uk | Journalisme graphique | Scoop.it
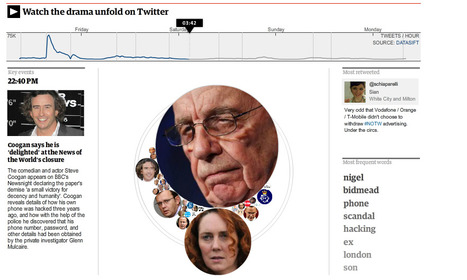
The Murdochs' decision to close the News of the World was greeted with a frenzy on Twitter.
No comment yet.
Scooped by Karen Bastien
Scoop.it!

When does Crime Happen?

When does Crime Happen? | Journalisme graphique | Scoop.it
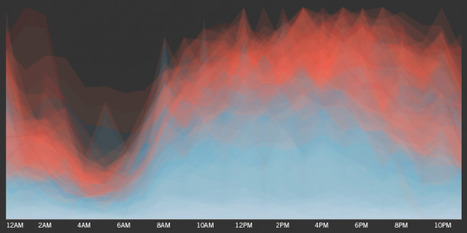
Crime doesn't pay, and it never sleeps – see 24 hours of crime in major US cities...
No comment yet.
Scooped by Karen Bastien
Scoop.it!

The Connected States of America

The Connected States of America | Journalisme graphique | Scoop.it
Où téléphone t-on le plus aux Etats-Unis ?
No comment yet.
Scooped by Karen Bastien
Scoop.it!

Les limites de vitesse dans le monde

Les limites de vitesse dans le monde | Journalisme graphique | Scoop.it
No comment yet.